Self-service reporting with formulae
There is a lot of versatility on pivot reporting. Even this variation used to make pivot with area, still there need more fundamental consideration to make your tabular or crosstab report to business meaningful documents.
Data scientist and data visualization! Why am I explaining basic tabular grid results in this more powerful and colorful visualization era? Yes, that is true but why business users lose their fundamental tool to do their job done right. SubTotal, PoT and all of those business formulae are self-instructional and useful.
In the previous article, I explained how versatile and considerations on the pivot table you need can make.
(How to make a pivot table with variations)
This example in this article is done on http://www.amplixbi.com data visualization software on the cloud. You can get free cloud service with your business email on the fly.

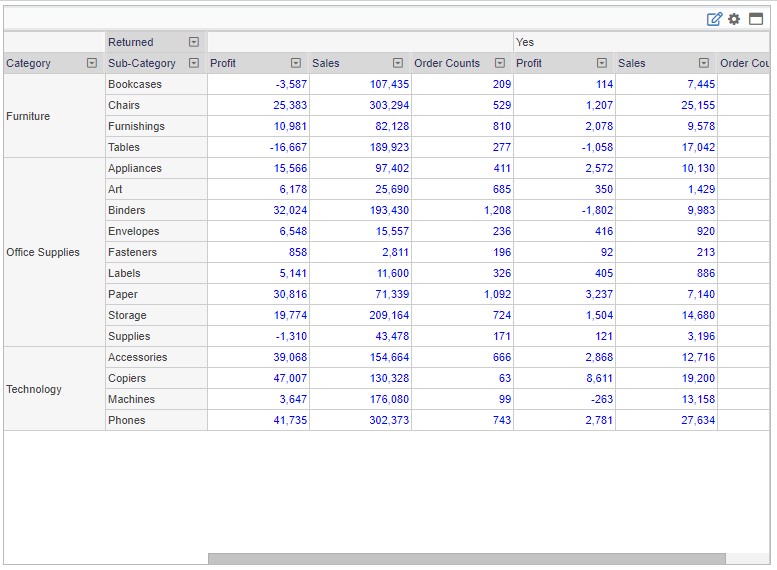
Below is a basic output of crosstab report. We will start from this report to show how to make your document more valuable results.
Percent of total
Let me talk about percent of total. You might see this is easy and there’s nothing to discuss to fill this document. But let’s see the difference with horizontal and vertical difference. The data shows your product category and subcategory have returned orders which shows on column area.
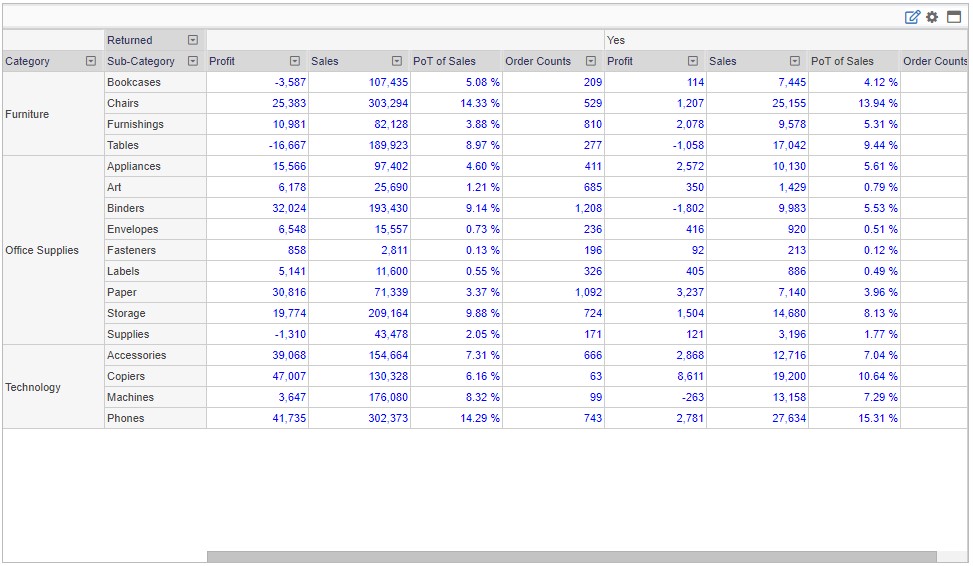
This is PoT of Sales by vertical summing up.
Compare with prior PoT of Sales by horizontal summing up.
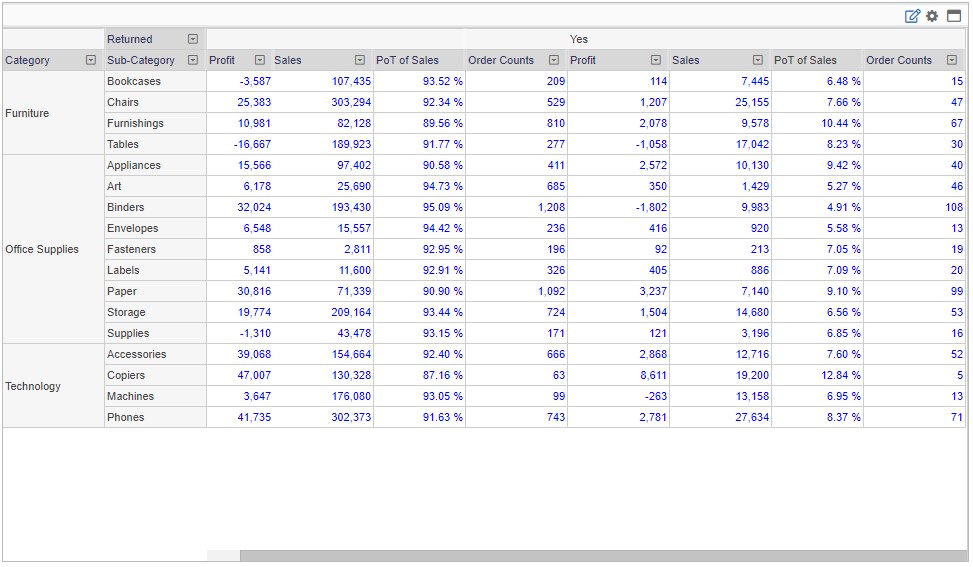
Yes. Horizontal PoT shows what is a percentage value for each category that how much returned directly. And vertical PoT is correct but have a different meaning that how much is returned for each category level.
So you can get Technology Phones are the highest return sales, but from the second table shows Technology Copiers are the highest return ratio per sales.
Subtotal
Your development team or IT department might think this topic might be trivial and there is not much variety on this. Let me show several possible cases below with what business users expecting from your work.
Let’s start with basic with subtotal for each category.
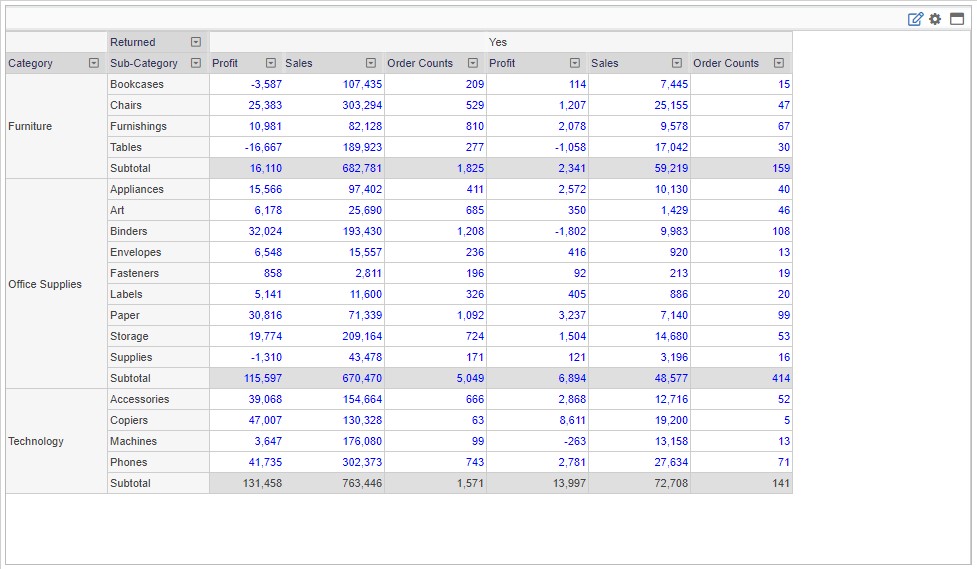
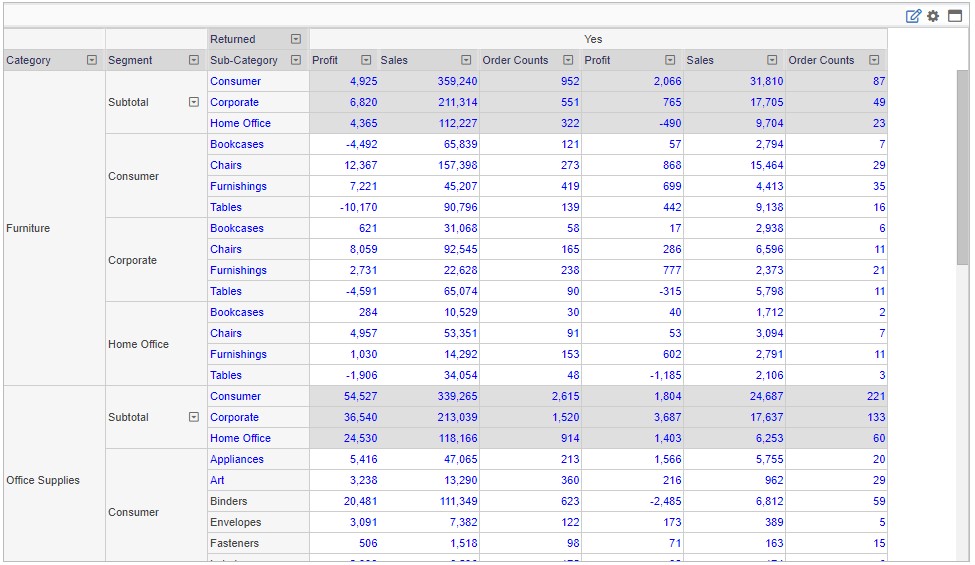
Ok, now how you can see the subtotal first for each category like this.
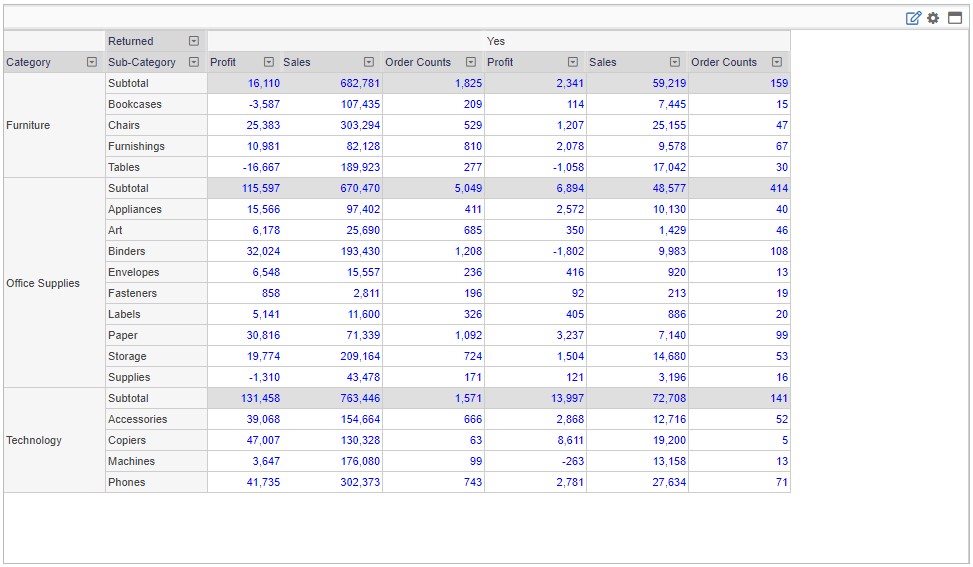
Why you need to check every row for subtotal. Your business user wants to see the subtotal as a group on top or bottom.
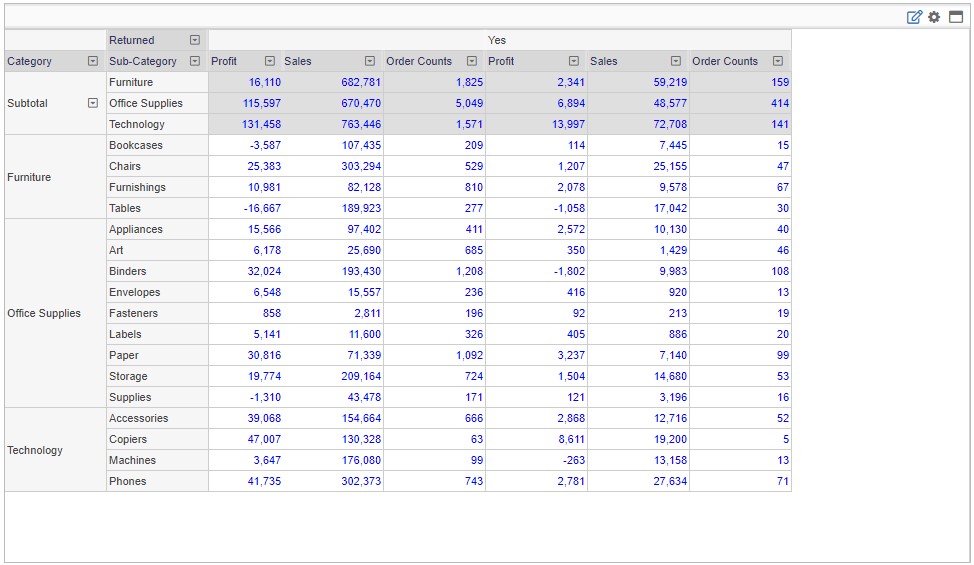
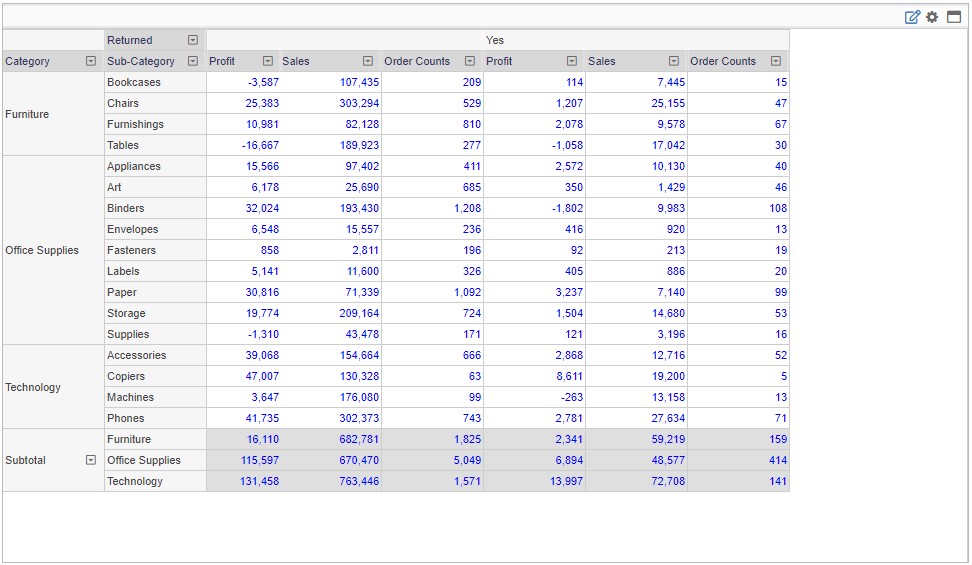
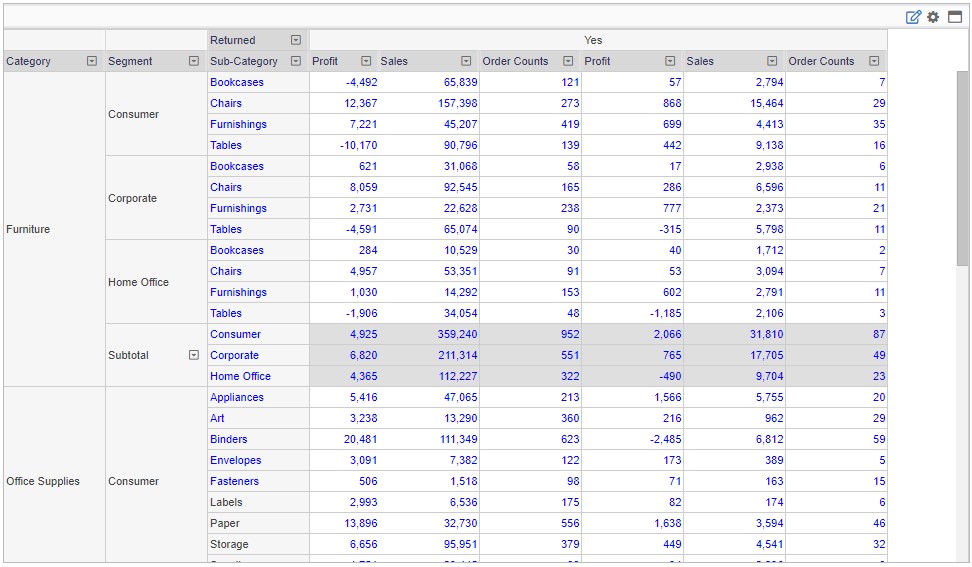
More complex SubTotal
Let’s make more detailed business reports with information full of self instructions.
Other consideration
I strongly disagree that grid has not much technics you can utilize for your business view. On the contrary, you need to know how important on this self-instructional data expressions. There are more items that can be replaced with the explained function of Subtotal and PoT on below.
- Subtotal and Grand total
- Average, Minimum, Maximum
- Percent of total
- Cumulative Percentage
- Incremental values
- Difference
- Ranking
- Standard Deviation and Standard Deviation P
- Percentile, Percentile Excel
Enjoy!