Survey Data Visualization
Backgrounds
This data visualization is based on open d ata downloaded from below link:
2017 Bloomington Community Survey Data Opt-in …
For each questionnaires and survey participants are listed on csv format. On the separate file, each questionnaires variables are listed.
Data Loading
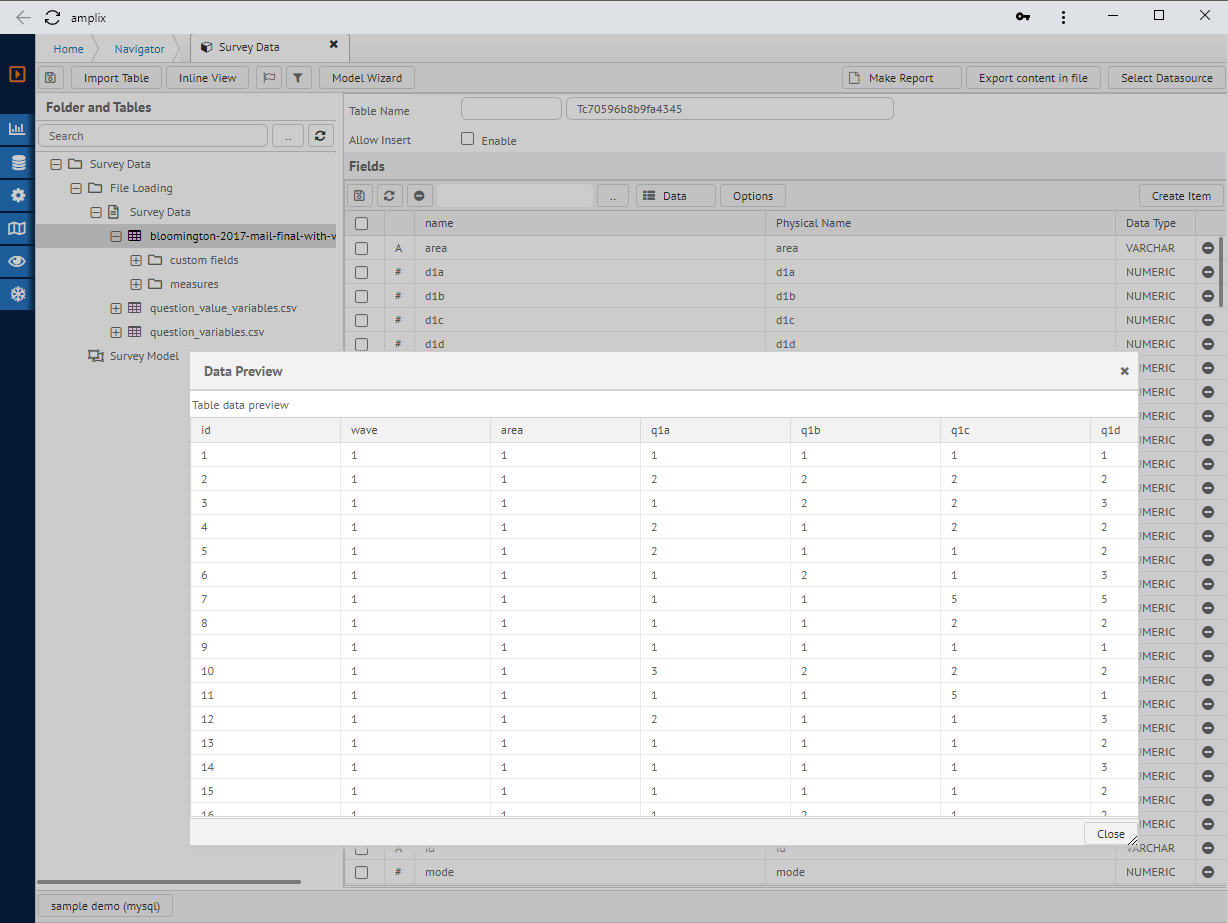
Upload survey data CSV file and questionnaires variable files with Data Loader service module. Below screenshot is Business Object with loaded survey data.
Survey Data Relational Model
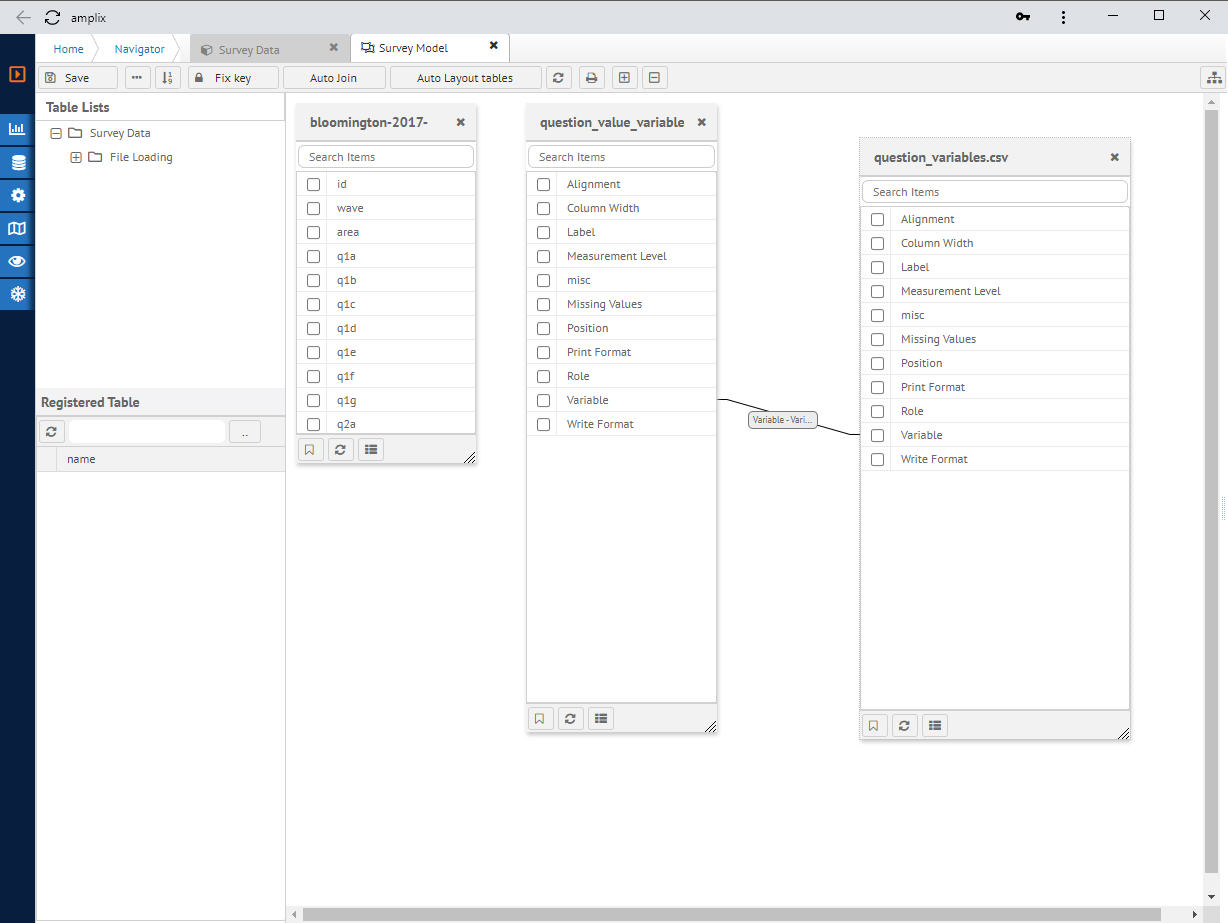
On Business Object, data modeler can define relation between data objects. For the data file structure is based on each column is questionnaires and row data is user’s selection on survey. Intentionally there is no relation between this table, and by defining Custom Dimension with SQL sub select option, the reports are automatically binded to get survey result data.
Survey Results by Drill Down
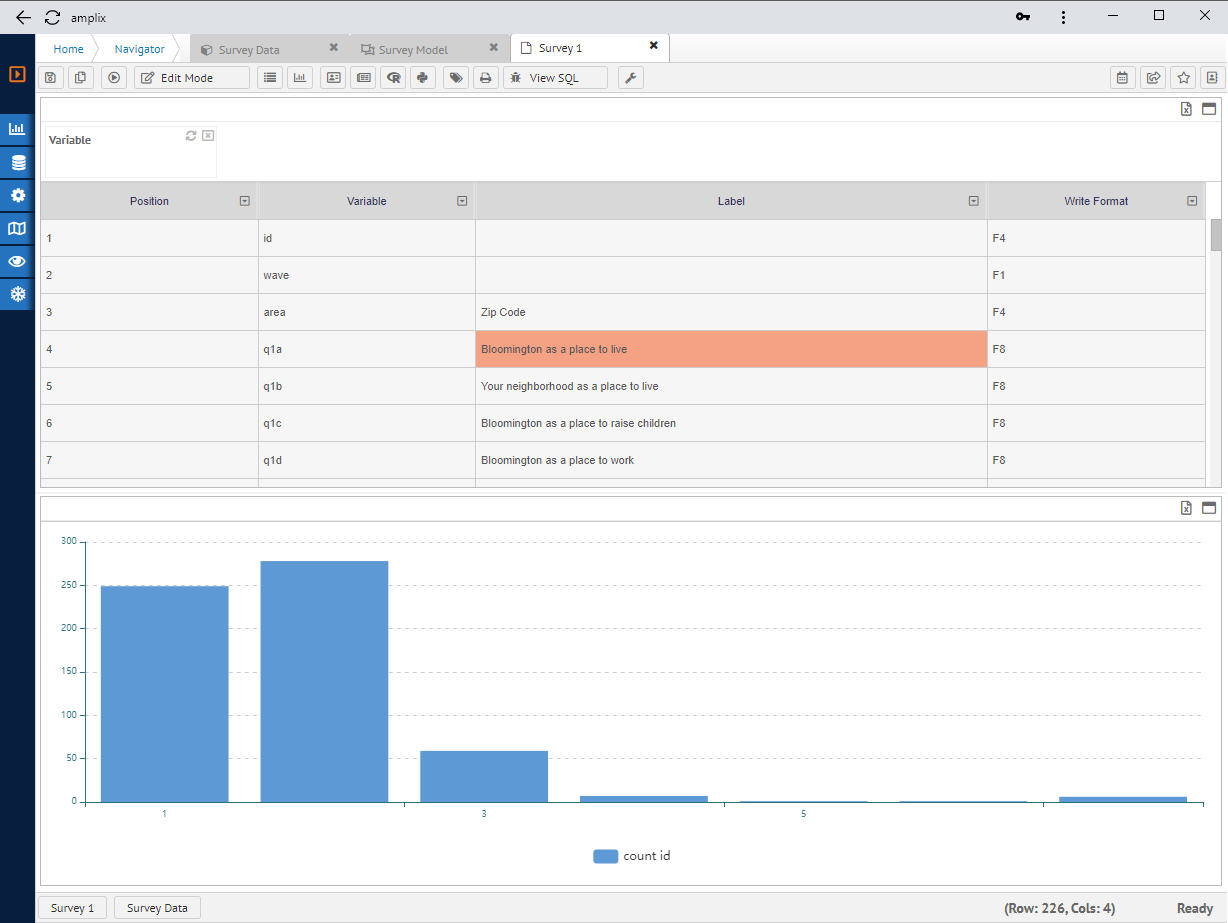
Click on questionnaire sheets and shows the detail and responses from user.
Quick Summary reports
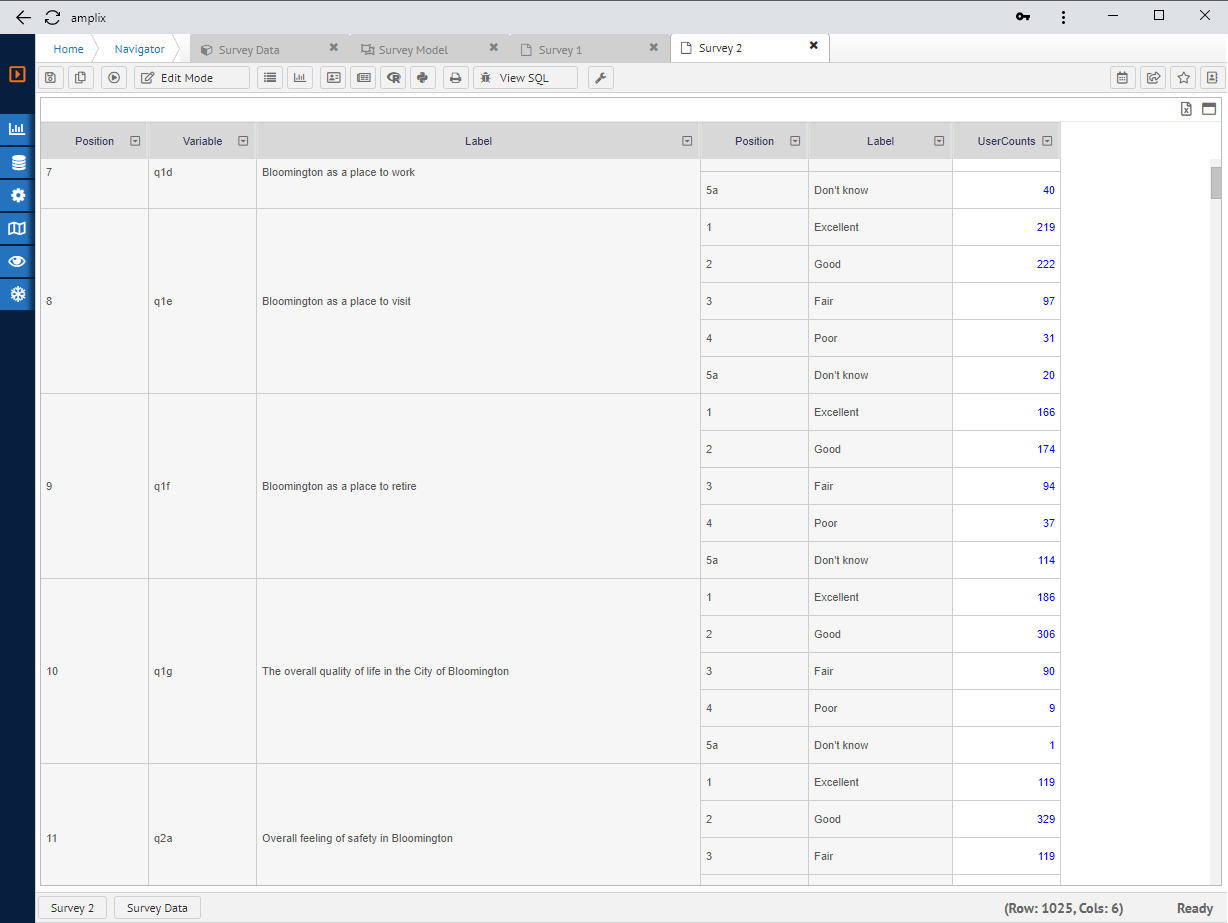
Using Custom Dimension and relational diagram the survey results are automatically gathered as pivot report.
Parallel Relation Diagram for the Survey
Parallel Relation Diagram makes simple to track the trends for individual set of data. The bar represents questions and variables on the question. The line between bar shows each individual participants to track questions. To get information about who answered on question 1 with Low, it shows other questions variable automatically.
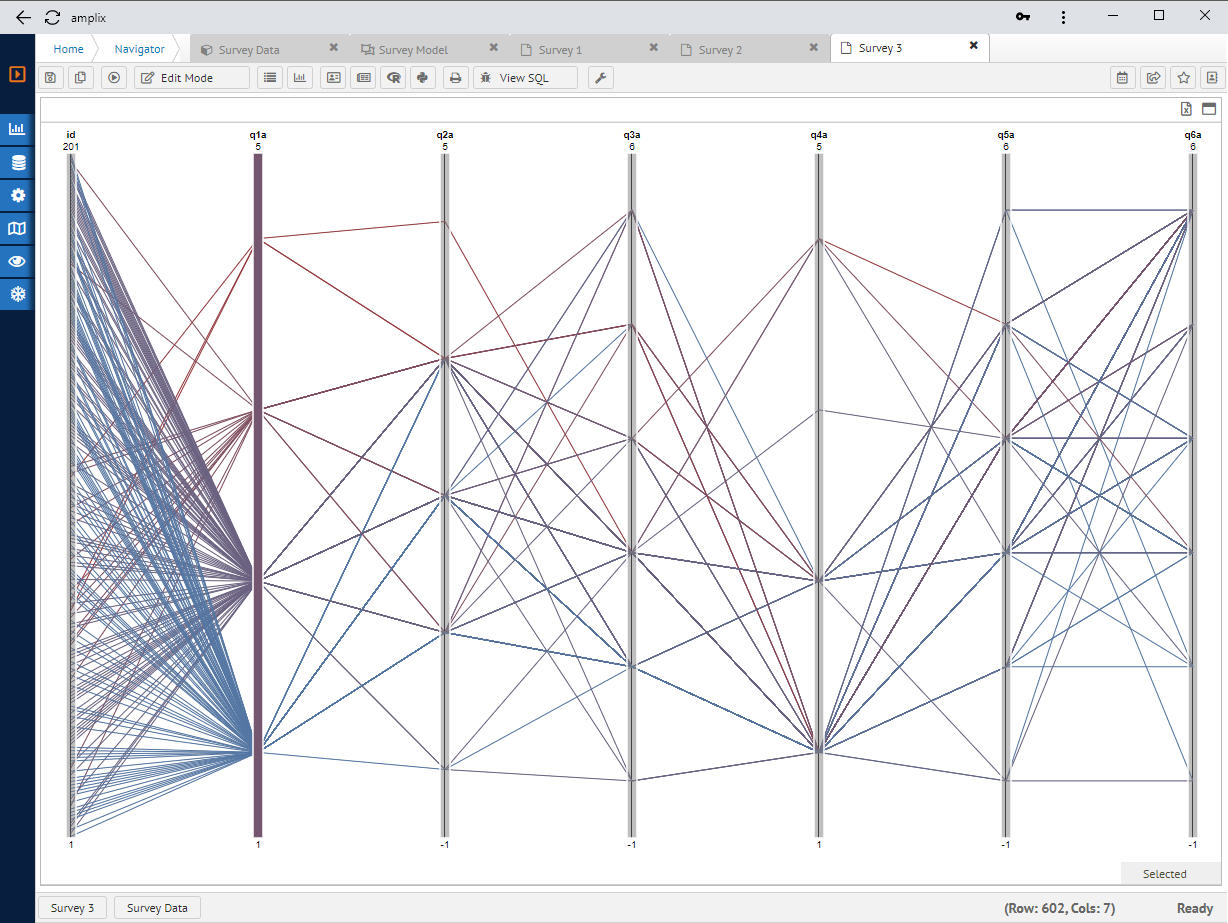
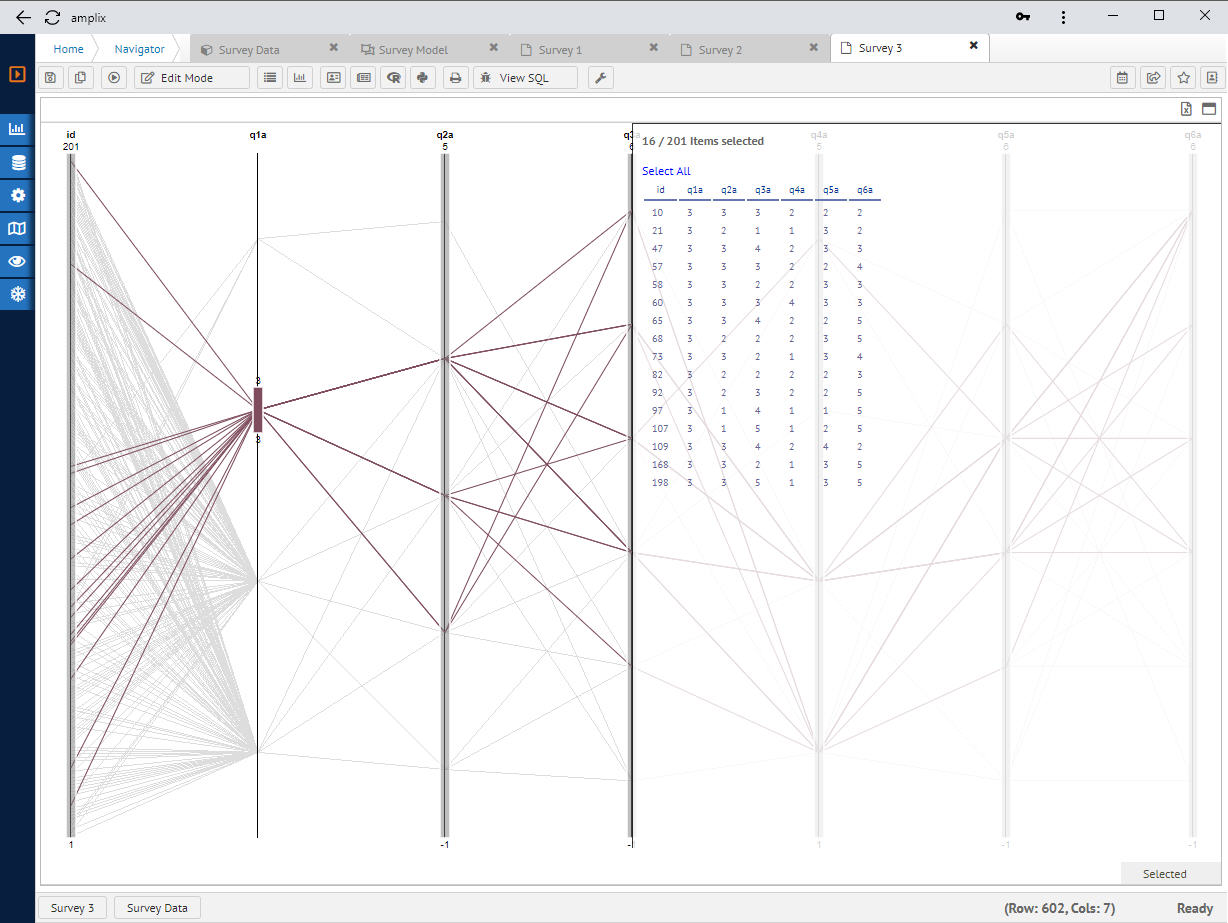
To get the detailed data that highlighted on the data, just click on Selection button on bottom.
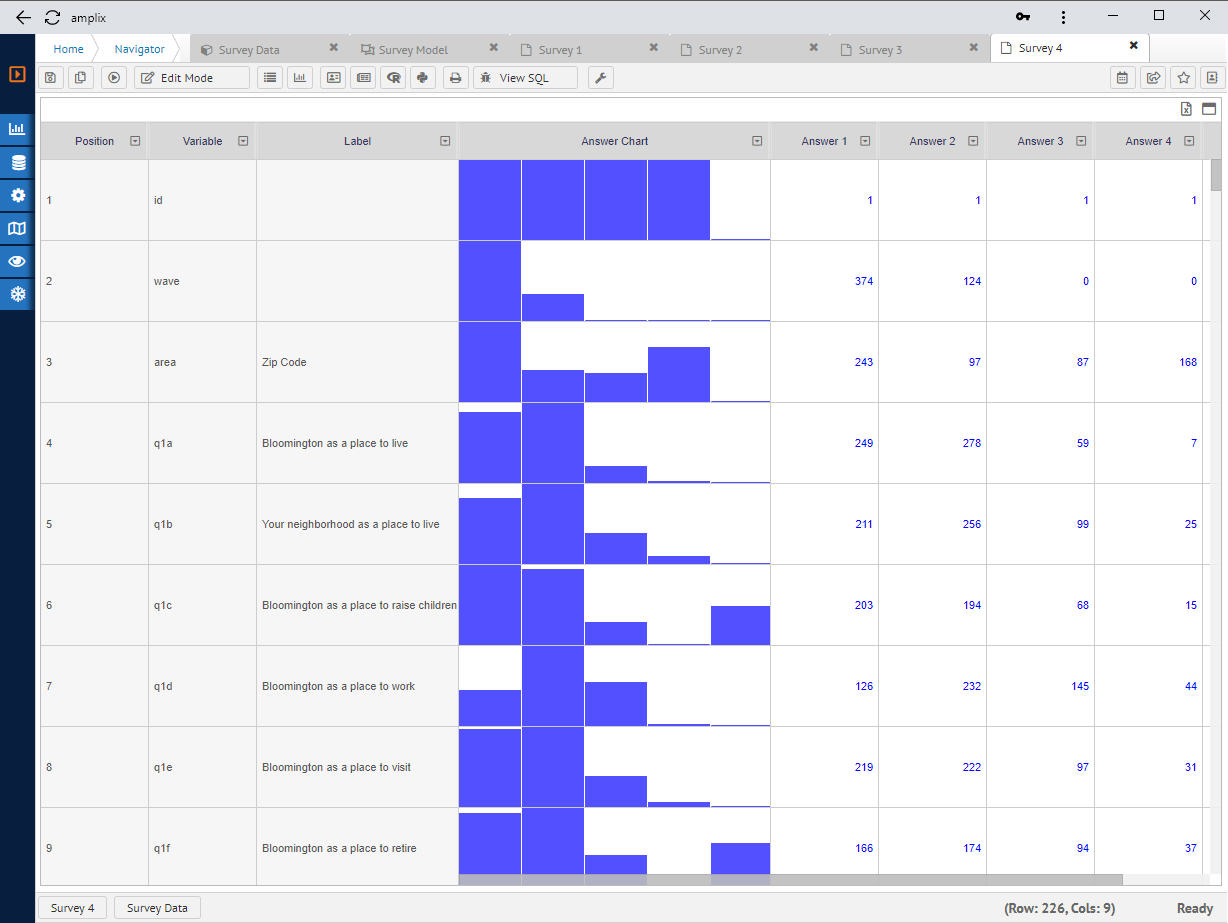
Cell Chart Comparison of the data
For each question, the cell chart denotes the count of responses for the variables. Side by side comparison is easier with all variable in single shot.
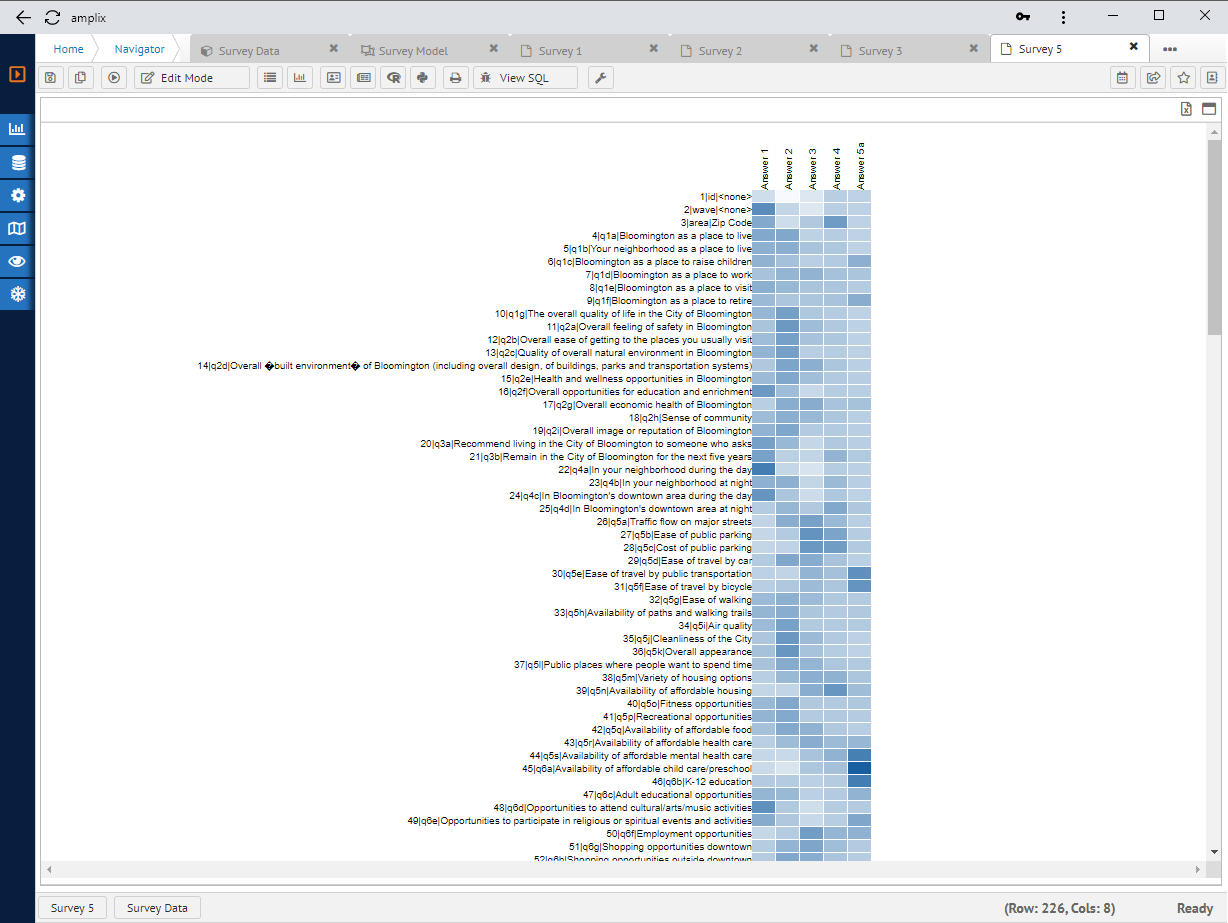
Heat map Comparison of the data
Heat map comparison is based on mean and deviation. The higher value denotes thicker colors and analysis is much simpler with comparing colors of report.
Further and more features
Thank you for reading! I hope you can utilize this to make your survey analysis more profound and intuitive with various visualization.
For more information and tools used in this documents, please visit https://www.amplixbi.com
Please feel free to request demo, proof of concept and evaluations. Also provides free cloud services for your data visualization.
Enjoy!