리포트 생성 및 활용
분석 보고를 위한 최종 리포트는 쉬트 기반 리포트, 복합 리포트로 구분된다. 복합 리포트는 복수의 피봇 정보를 병합한 특수한 형태의 보고서를 의미한다.
|
From navigator right click on folder item, and on popup menu select create -> Report to create report on folder. |
|
|
|
|
|
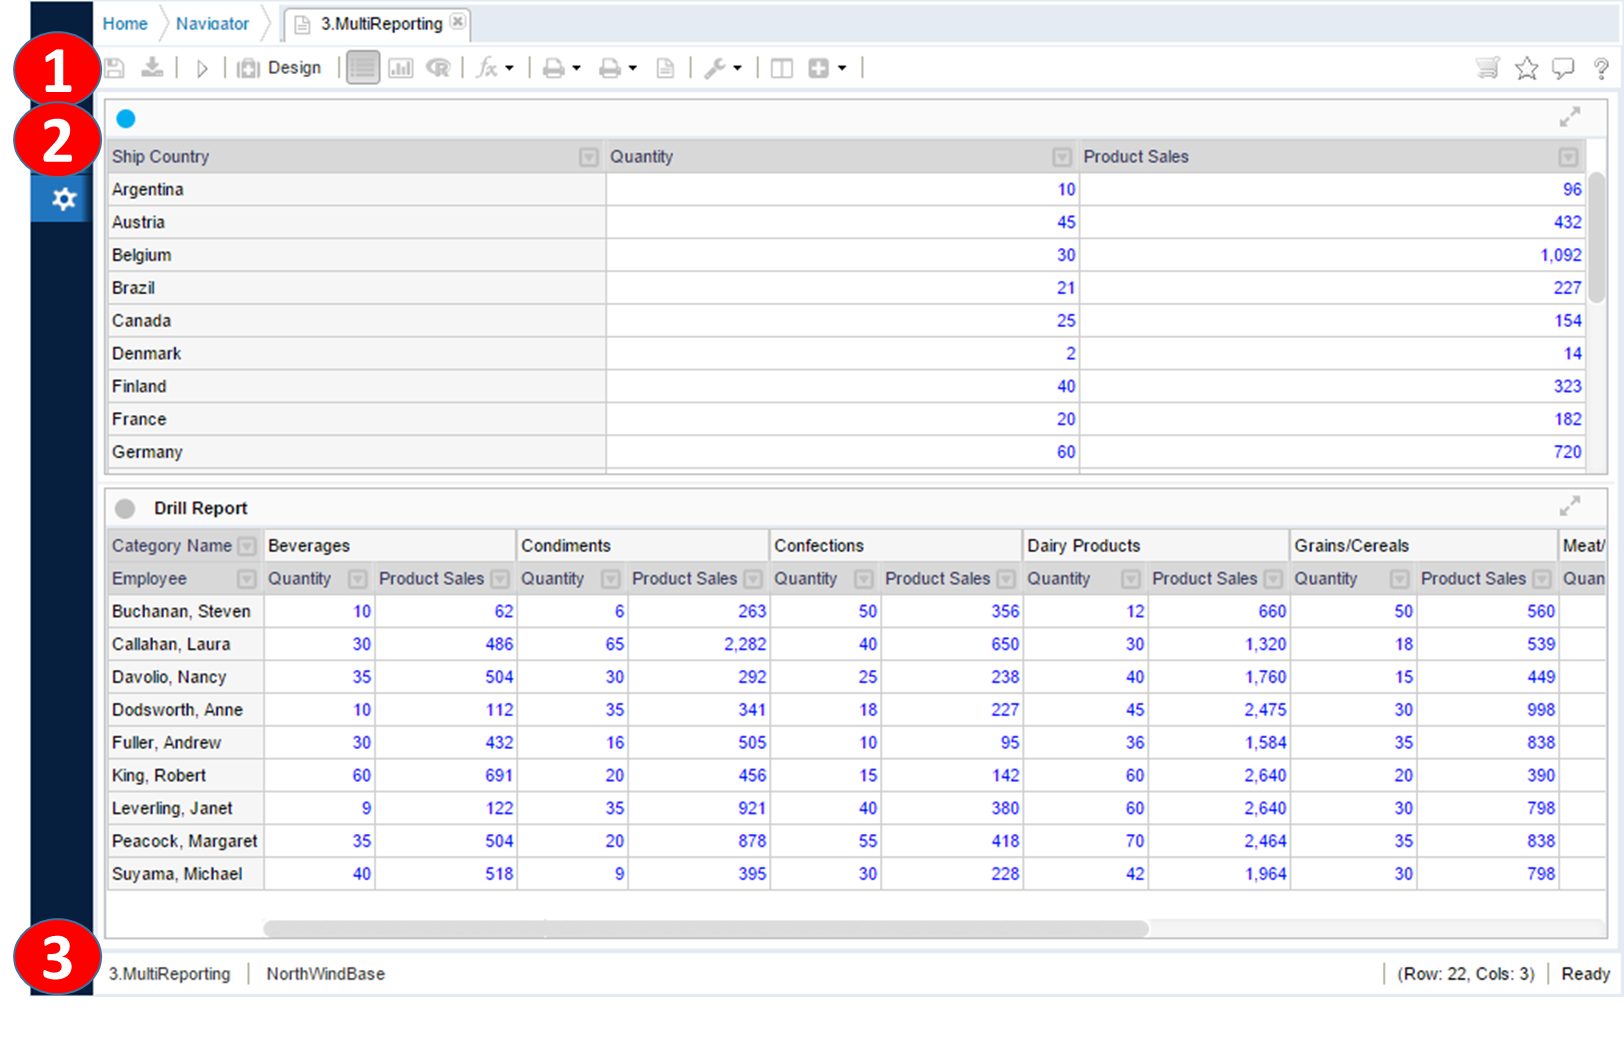
1 |
리포트 툴바 |
|
2 |
리포트 위젯 닥킹 영역 |
|
3 |
하단 상태바 |
리포트 툴바 구성
리포트 툴바는 보기모드(그리드, 챠트, R결과)에 따라 메뉴가 동적으로 변환된다.
|
Button name |
Description |
Notes |
|
Save |
Save report content with current configuration |
Visible when writable |
|
Save as |
Copy current report and create new reports with different name |
|
|
Execute |
Initialize each sheet results and run the reports with run on load checked sheets. |
|
|
Design Mode / Edit Mode |
Toggle design mode / view mode |
|
|
View as Grid |
Change to grid view mode on currently active sheet. |
|
|
View as Chart |
Change to chart view mode on currently active sheet. |
|
|
View as R Result |
Change to R view mode on currently active sheet. |
|
|
View as Python |
Change to Python view mode on currently active sheet. |
|
|
Export and download |
Export and download for current report |
|
|
Options |
Export and download options. |
|
|
Tools |
Other advanced options |
|
|
Tools * Statistics |
Statistics results for currently active and executed report sheet. |
|
|
Add layout |
Add widget in layout. |
|
|
Chart Wizard |
Detailed chart configuration wizard |
Chart view mode |
|
Chart Selection |
Quick chart selection toggle button |
Chart view mode |
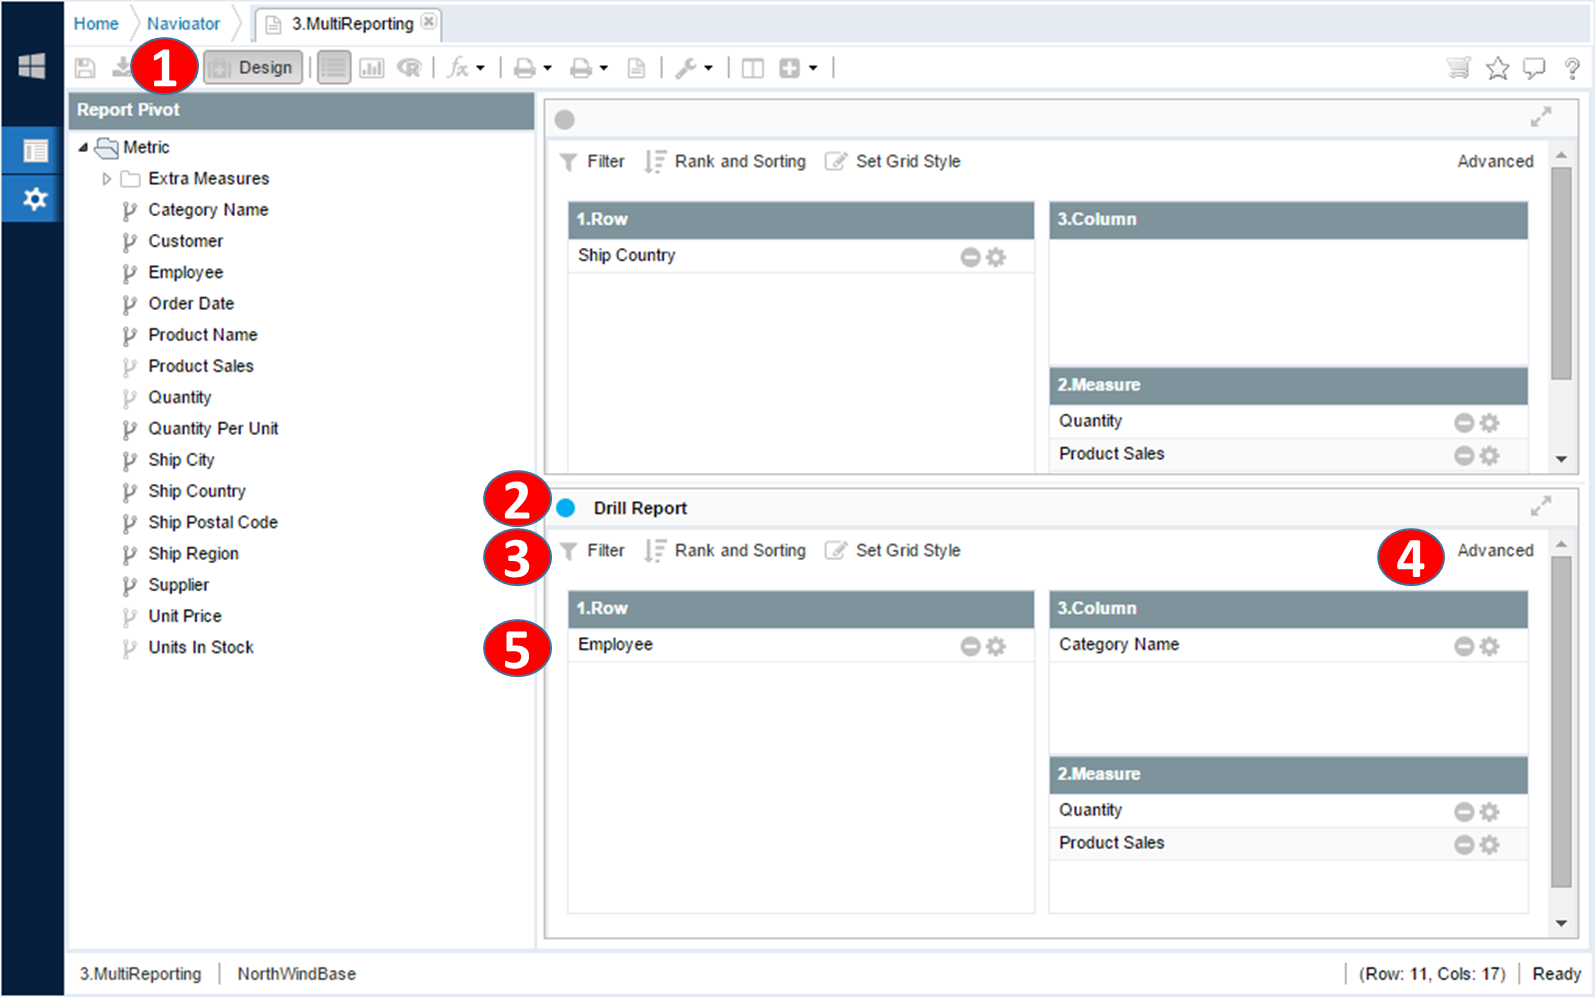
리포트 디자인 모드 변경
리포트 툴바의 디자인 모드를 클릭하여 리포트 피봇 및 상세 옵션에 대한 변경을 위한 디자인 모드로 변환한다.
|
리포트 툴바의 디자인 버튼을 클릭하여 디자인 모드로 전환한다 |
|
|
|
|
|
1 |
리포트 툴바의 디자인 버튼을 클릭하여 디자인 모드로 변경한다. |
|
2 |
위젯의 타이틀바 아이콘이 액티브 창인 경우 하이라이트 된다. |
|
3 |
필터 설정, 정렬, 랭크 및 그리드 스타일 설정을 변경한다. |
|
4 |
고급 설정 옵션을 설정 변경하기 위한 설정 화면을 연다. |
|
5 |
행, 열, 메져 영역에 사용될 디멘젼, 메져의 피벗 구성을 정의한다. |