Sales status using Inline SQL
This section takes advantage of the various features of the Inline SQL view to develop reports and charts using sales data.
Create workspace for tutorial
Create a new workspace tutorial in the Navigator.
|
After logging in, go to the navigation tab. |
|
|
|
|
|
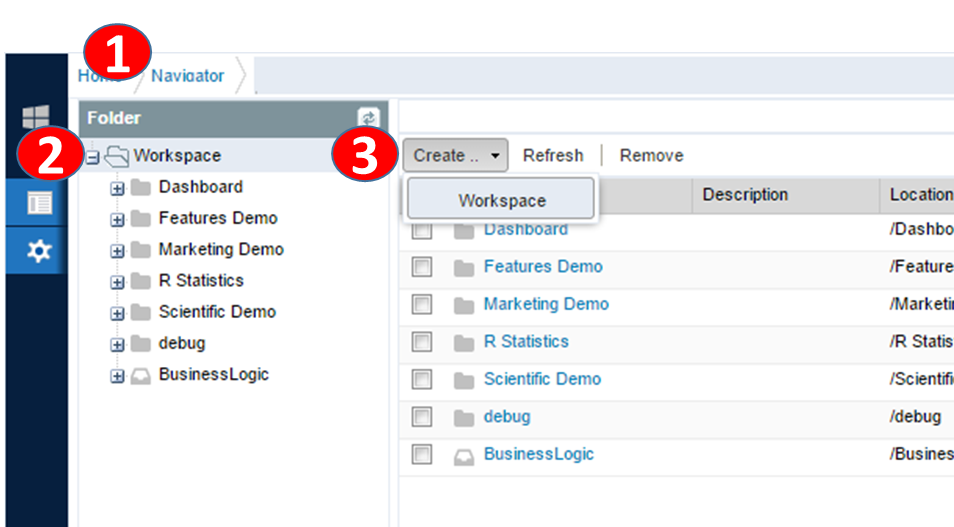
1 |
After logging in, go to the navigation tab. |
|
2 |
Click on the top workspace. |
|
3 |
Click the New Item button and select a workspace from the pop-up button. |
|
|
Enter the workspace name Tutorial and description and click the OK button. |
|
|
Click the Refresh button on the folder title bar. |
Code Mapping
Create code mapping table for code values M and F for Male and Female.
|
Click System Administrator menu and click Analysis - System Code Management. |
|
|
|
|
|
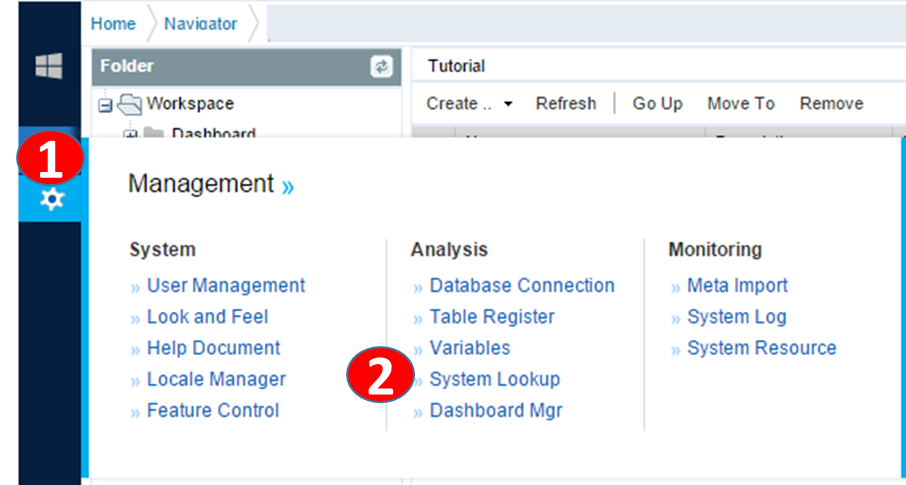
1 |
Click the System Administration menu. |
|
2 |
Click the Analyze - System Code Management entry in the menu. |
|
Create a code mapping entry. |
|
|
|
|
|
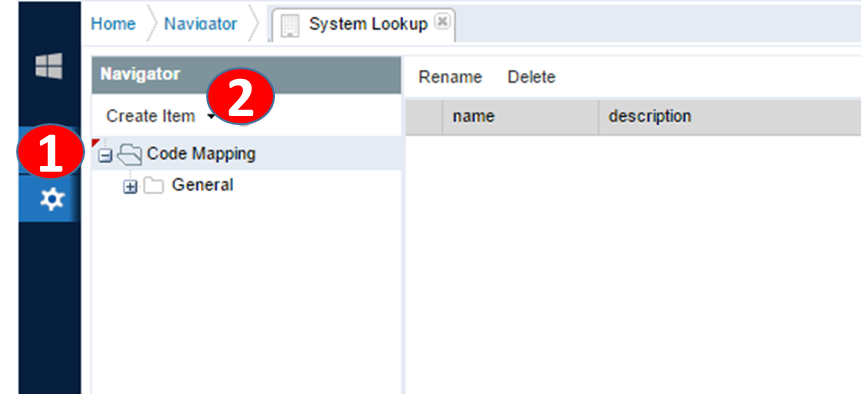
1 |
Click on the Code Mapping tree item and click the New Item button on the toolbar. |
|
2 |
In the New Item drop-down list, click the folder. |
|
|
Create a folder with the name General. |
|
|
Click the General folder and then click the New Item drop-down to select the code mapping entry. |
|
|
Enter the item name Gender and click the OK button. |
|
|
Click Gender in the grid list to edit it. |
|
Click on the generated code mapping entry Gender to edit it. |
|
|
|
|
|
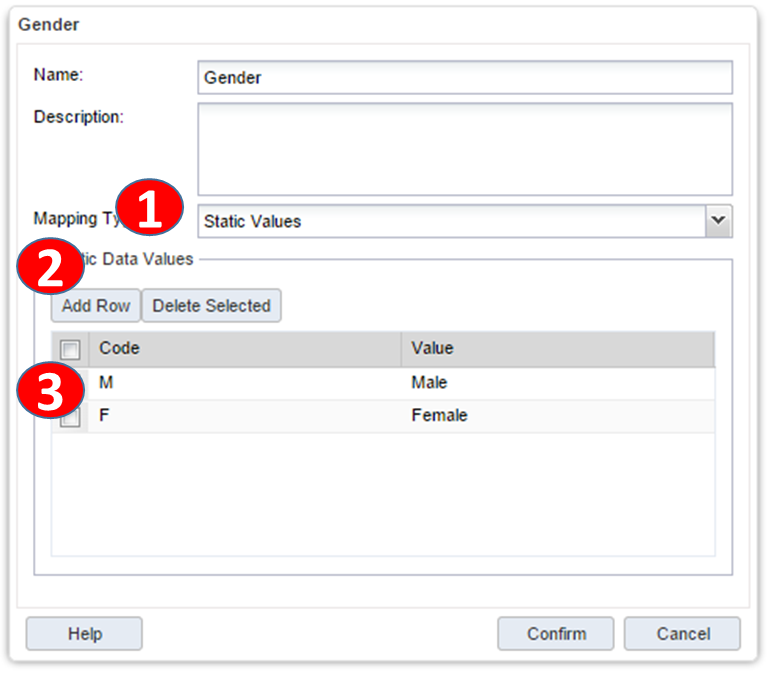
1 |
Select a static value for the mapping type attribute. |
|
2 |
Click the Add Row button to add a code / value entry. |
|
3 |
Enter the value by double clicking on the line. |
|
|
Click the OK button to save. |
Set SQL Query
The SQL query to use as an example is shown below.
|
SELECT |
Dynamic SQL query with prompts
|
Query Pattern |
Description and Example |
|---|---|
|
IF Condition |
If store_country is defined on filter, then execute the inside block.
|
|
IF ELSE Condition |
If store_city is defined then execute the If block. Other condition is executed on ELSE block.
|
|
IF Compare Parameter |
Execute block with checking parameter values.
|
|
Variables |
Replace variables with proper values at runtime.
|
|
Default variables |
${SHEET_NAME} : Sheet name of request items. |
Query example with dynamic filtering options
|
SELECT @IF ${store_city} AND fm_store.store_city in (${store_city}) @ELSE AND 1=1 @END IF GROUP BY fm_store.store_country, fm_store.store_city, fm_sales_fact.sales_year, fm_sales_fact.product_id, fm_customer.gender, fm_customer.fname, fm_customer.lname |
Create SQL InlineView
Within the Workspace folder, create a Customer Analysis folder and create a Business Object called CustomerBO.
|
Click the Navigation tab. |
|
|
|
|
|
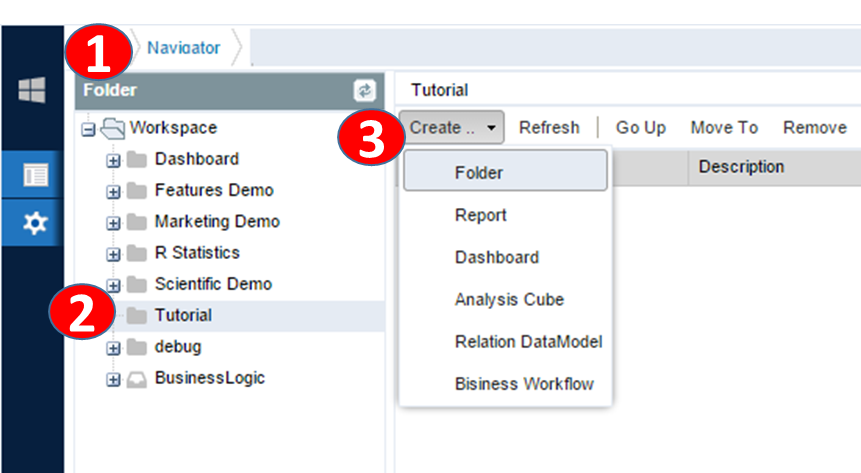
1 |
Click the Navigation tab. |
|
2 |
Click the Tutorial folder to select it. |
|
3 |
Click the New Item drop-down on the navigation toolbar menu and click on the folder. |
|
|
In the Create New Item popup window, enter Customer Analysis as the item name and click the OK button. |
|
|
Click the Refresh button to view the list again. |
|
Create a Business Object. |
|
|
|
|
|
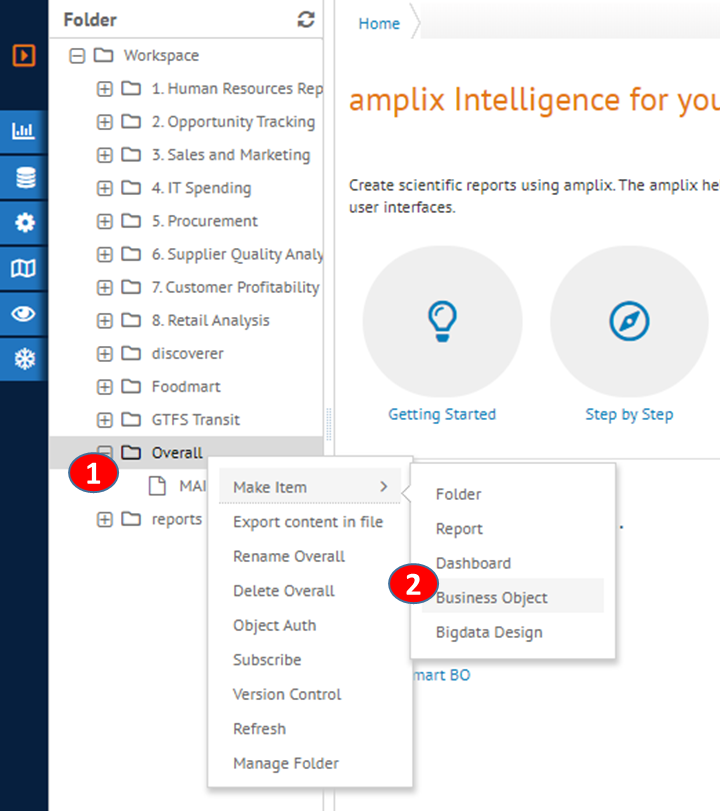
1 |
Click the Customer Analysis folder to select it. |
|
|
Click the New Item drop-down button. |
|
2 |
In the drop-down list, select the Business Object. |
|
3 |
Enter the name of the Business Object to be created and click the OK button. |
|
|
Click on the name of the Business Object created in the navigation, and then click the Edit Cube button in the toolbar to open the edit screen. |
|
|
|
|
1 |
Click on Business Object item to open in a tab window. |
|
2 |
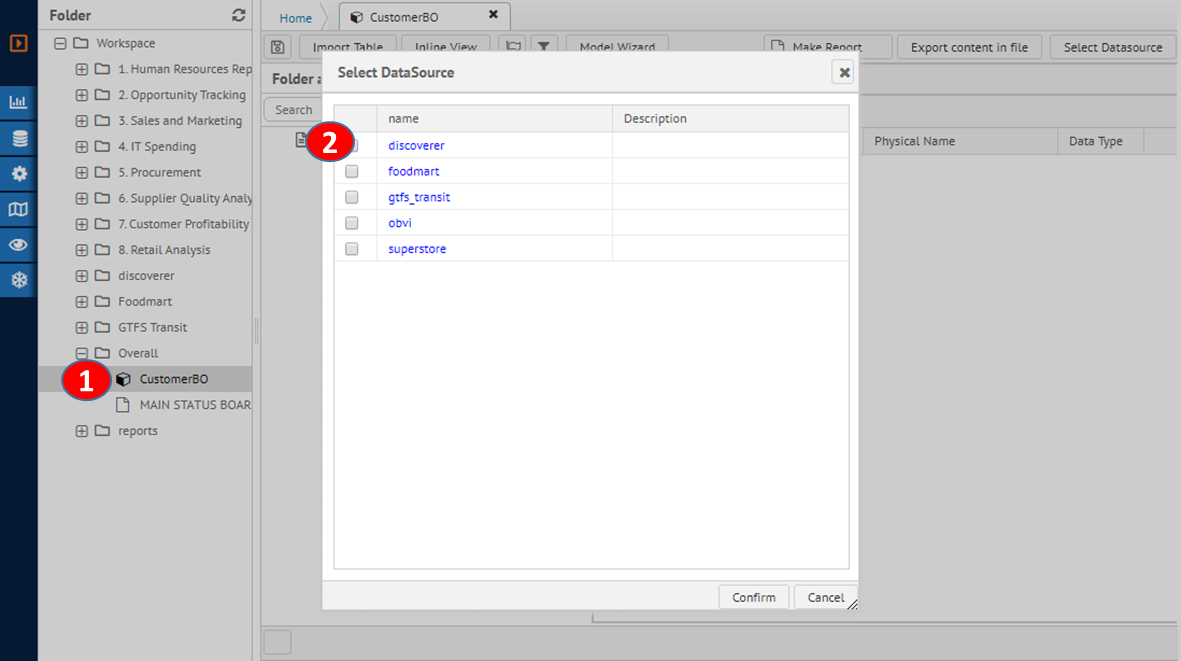
Select database source to use on this Business Object. |
|
Registering Inline SQL View |
|
|
|
|
|
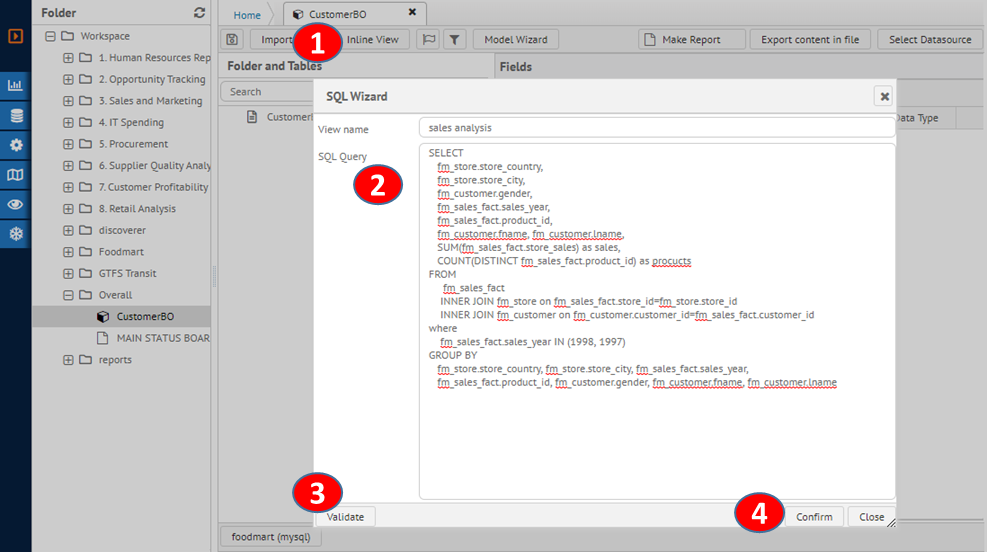
1 |
Click Inline View button on toolbar to register SQL query. |
|
2 |
Type or paste from clipboard for the SQL query. |
|
3 |
Click validate button to check validation of the sql. |
|
4 |
Click confirm to save to meta database. |
|
Create dimension items |
|
|
|
|
|
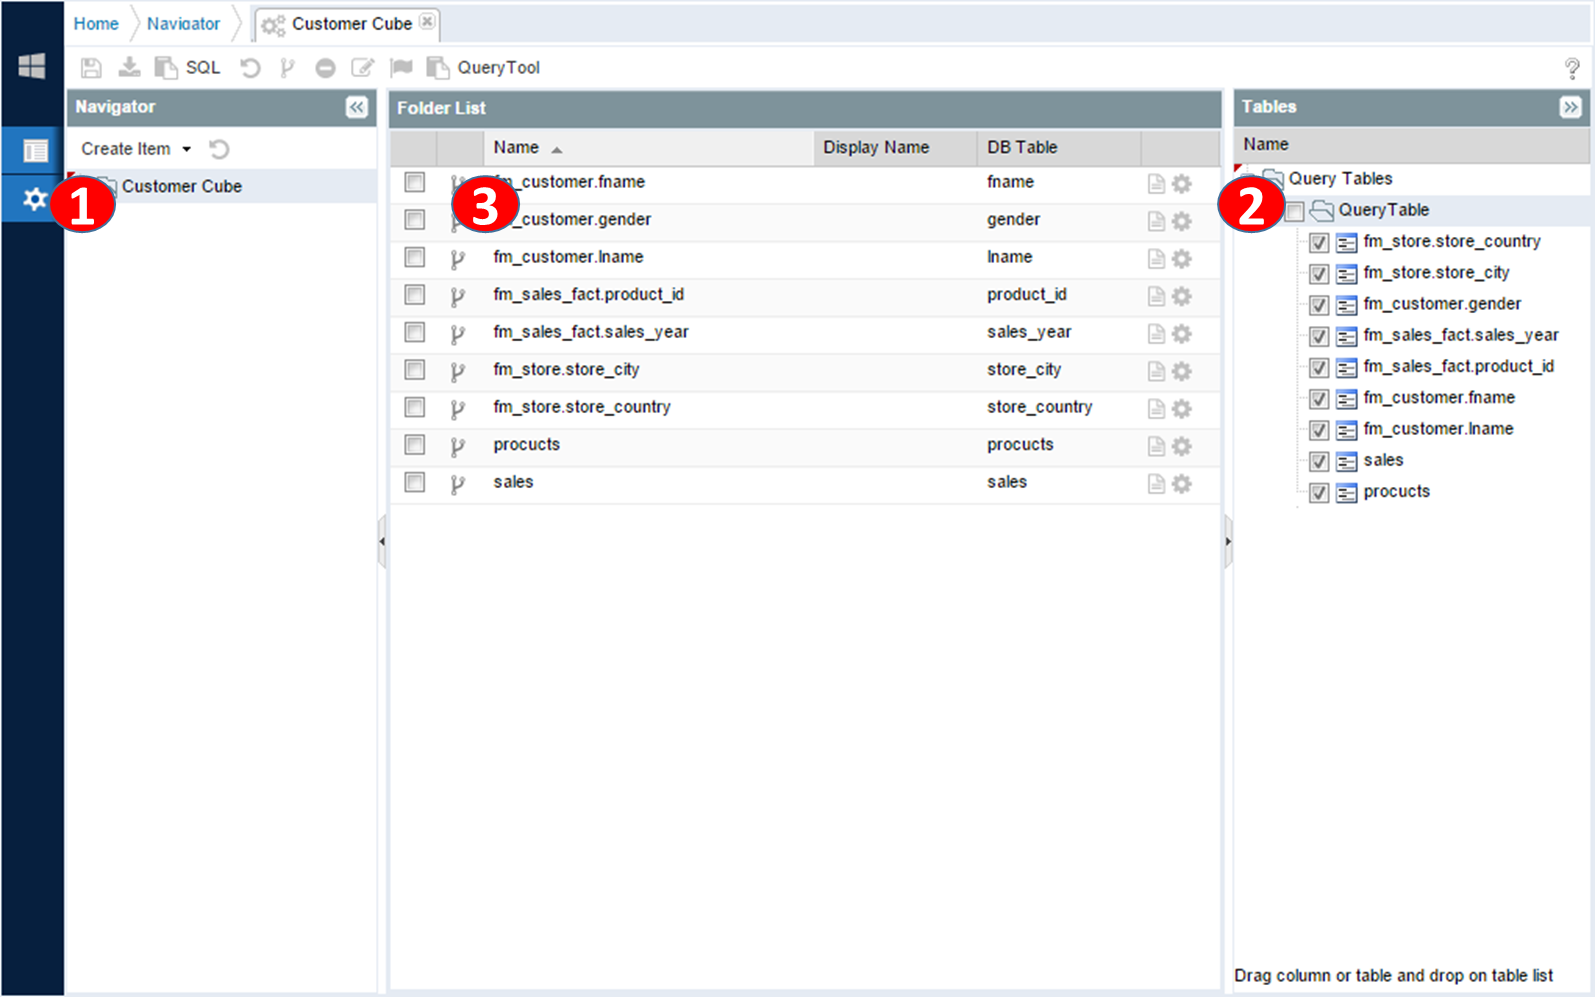
1 |
Click the folder where you want to store the metric |
|
2 |
Drag the extracted field items from the SQL Query Wizard (3) and drop them into the area. |
|
3 |
The dropped metric item is queried. |
|
|
Click the Save button to reflect your changes. |
Multiple Measure Register and Measure Definitions
|
|
|
|
Steps to follow |
|
|
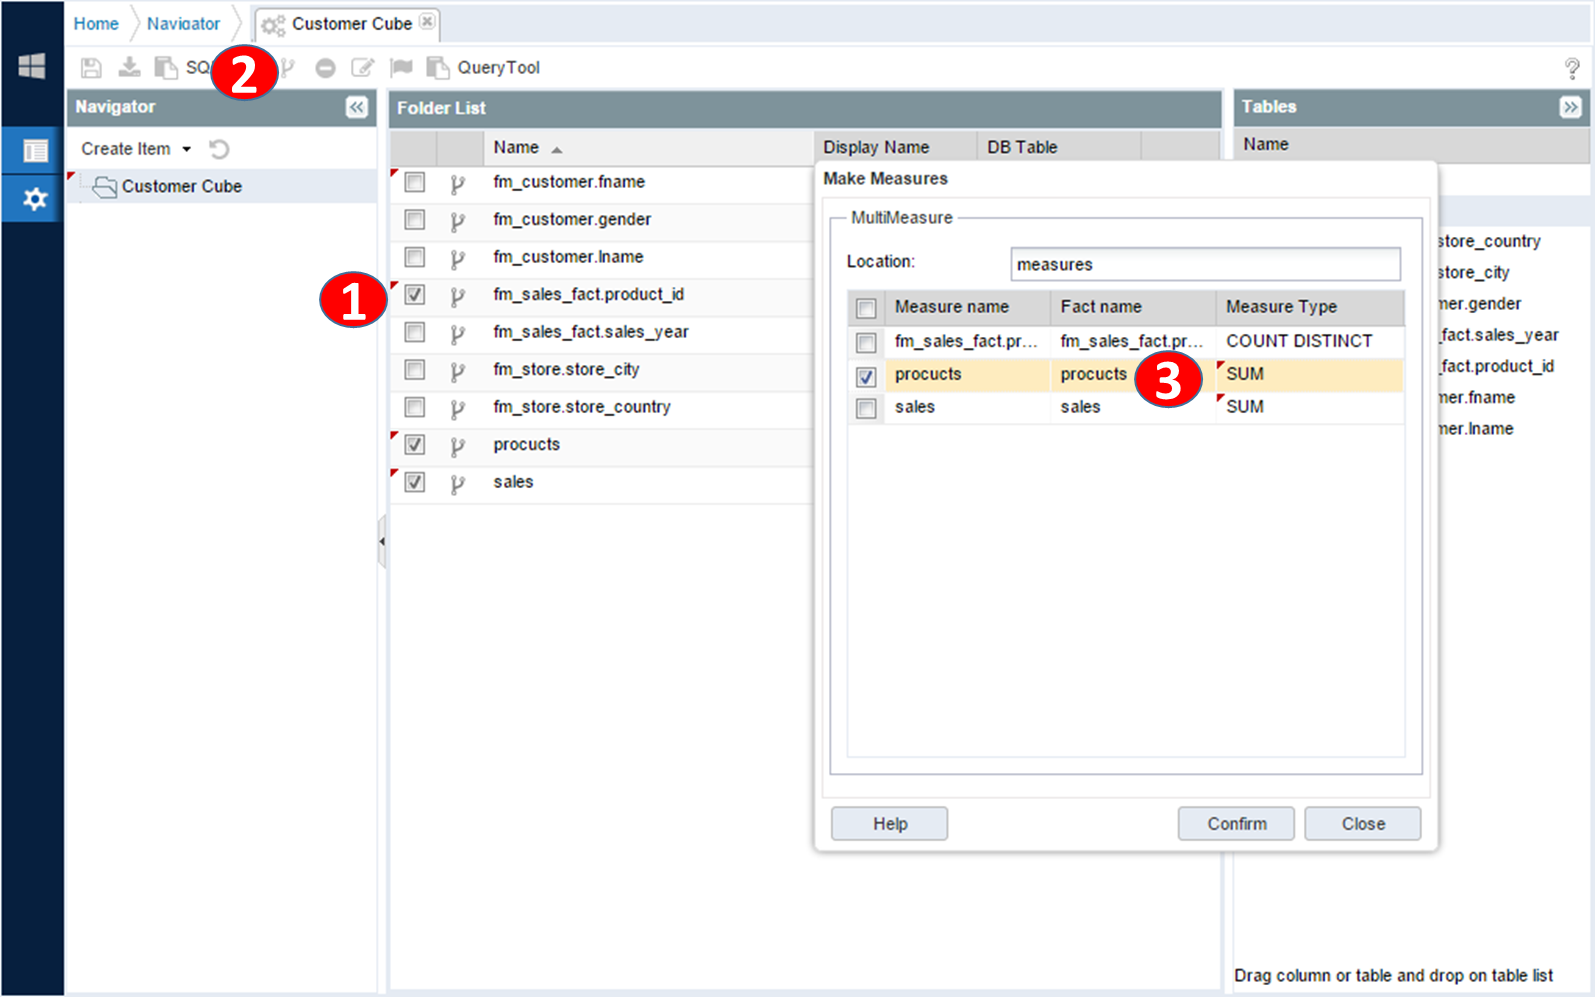
1 |
Check the items to be registered as the measure item. |
|
2 |
Click on the multiple measure registration button on the toolbar to select the meter item. |
|
3 |
Change the SQL function (SUM / COUNT) to the appropriate value for the column. |
|
4 |
Click the OK button to reflect the changes and create new measures. |
|
|
Click the Refresh button on the toolbar to confirm the creation. |
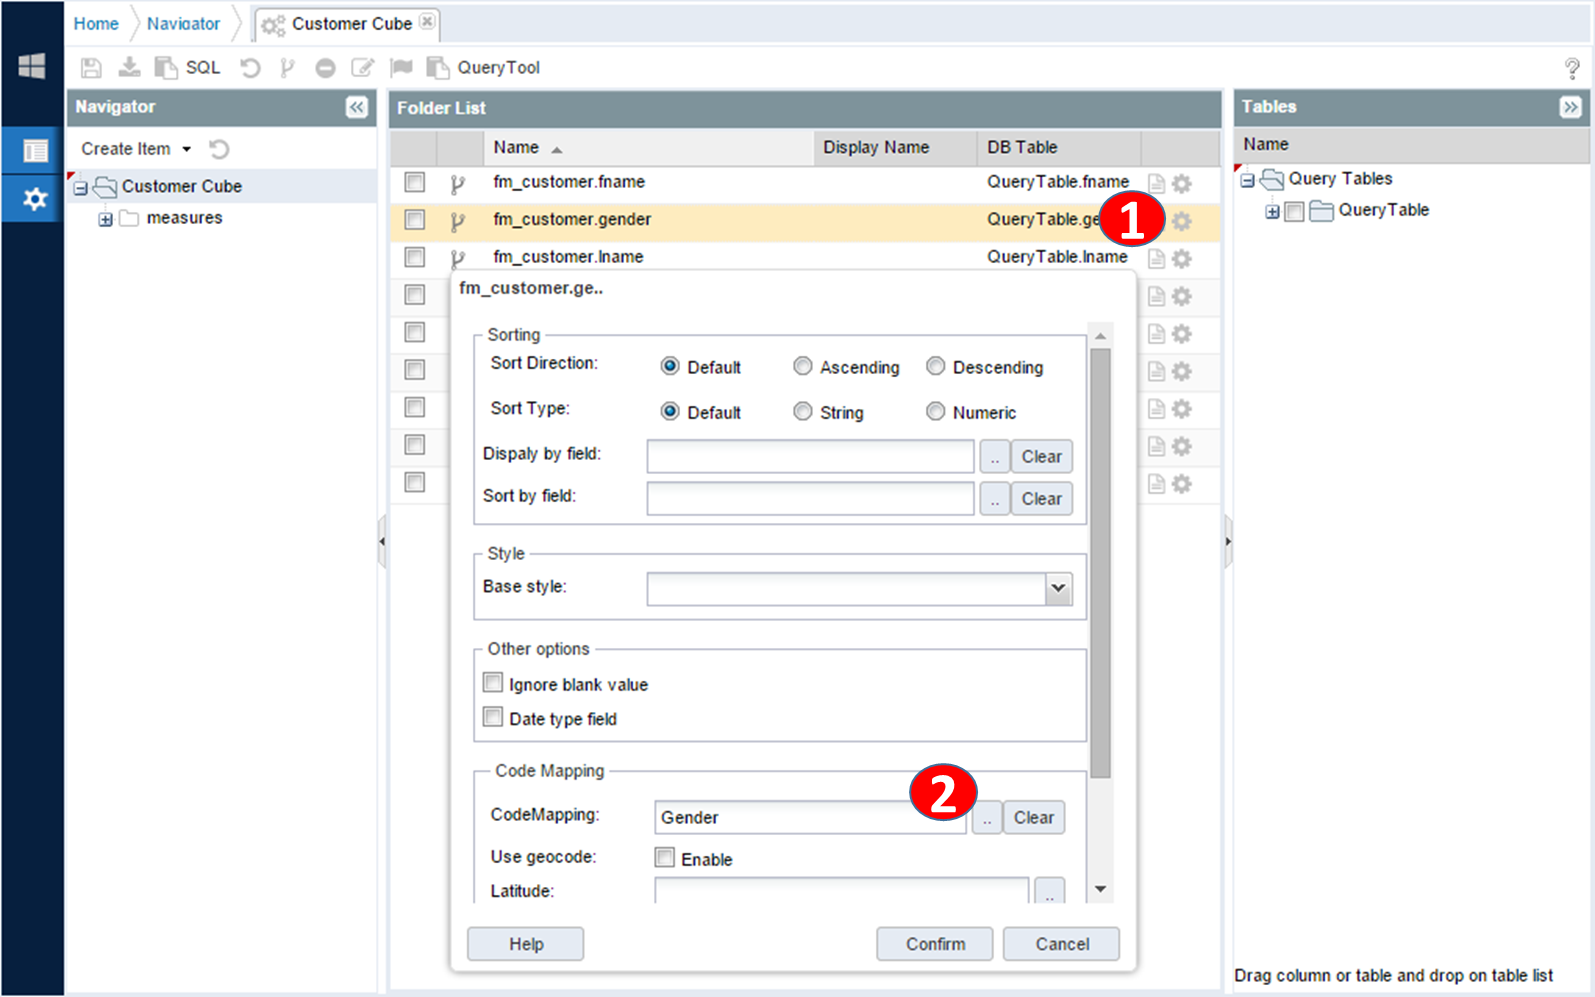
Set dimension items
Set the dimension to be used for the value lookup.
|
|
|
|
Steps to follow |
|
|
1 |
Click the Settings button for the generated Gender item. |
|
2 |
In the code mapping section, click the Find button to register the Gender item in the generated management menu. |
|
3 |
Click the OK button to reflect the changes to the server. |
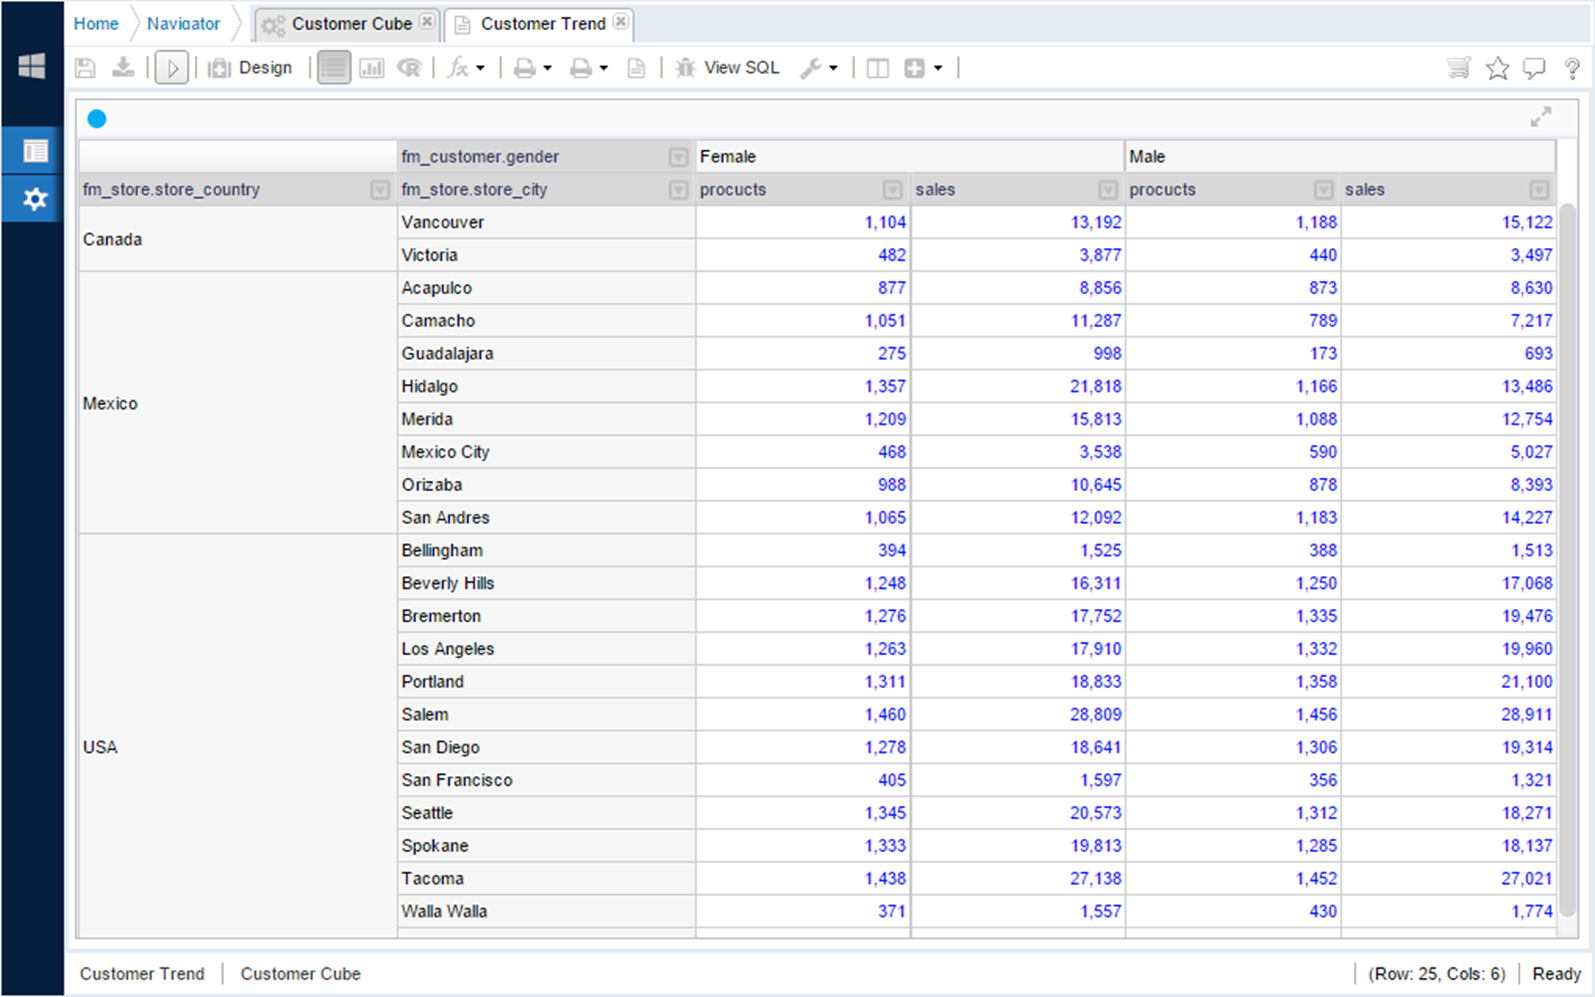
Creating Sales Report
Create a report on the sales situation using the pre-created analysis cubes.
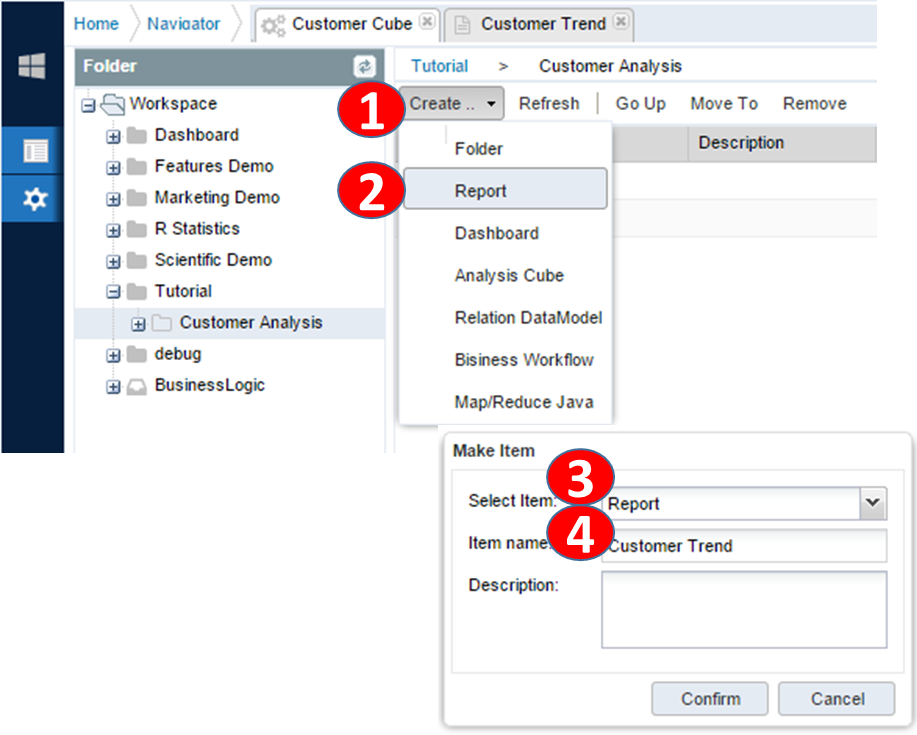
Creating Report
|
Create a new report Customer Trend in the analytic cube. |
|
|
|
|
|
1 |
Click the New Item drop-down button in the navigation. |
|
2 |
Click the report item in the drop-down menu. |
|
3 |
On the Create New Item pop-up screen, select the report item type. |
|
4 |
Enter the name of the report to be created |
|
|
Click the OK button to reflect the changes and create a new item. |
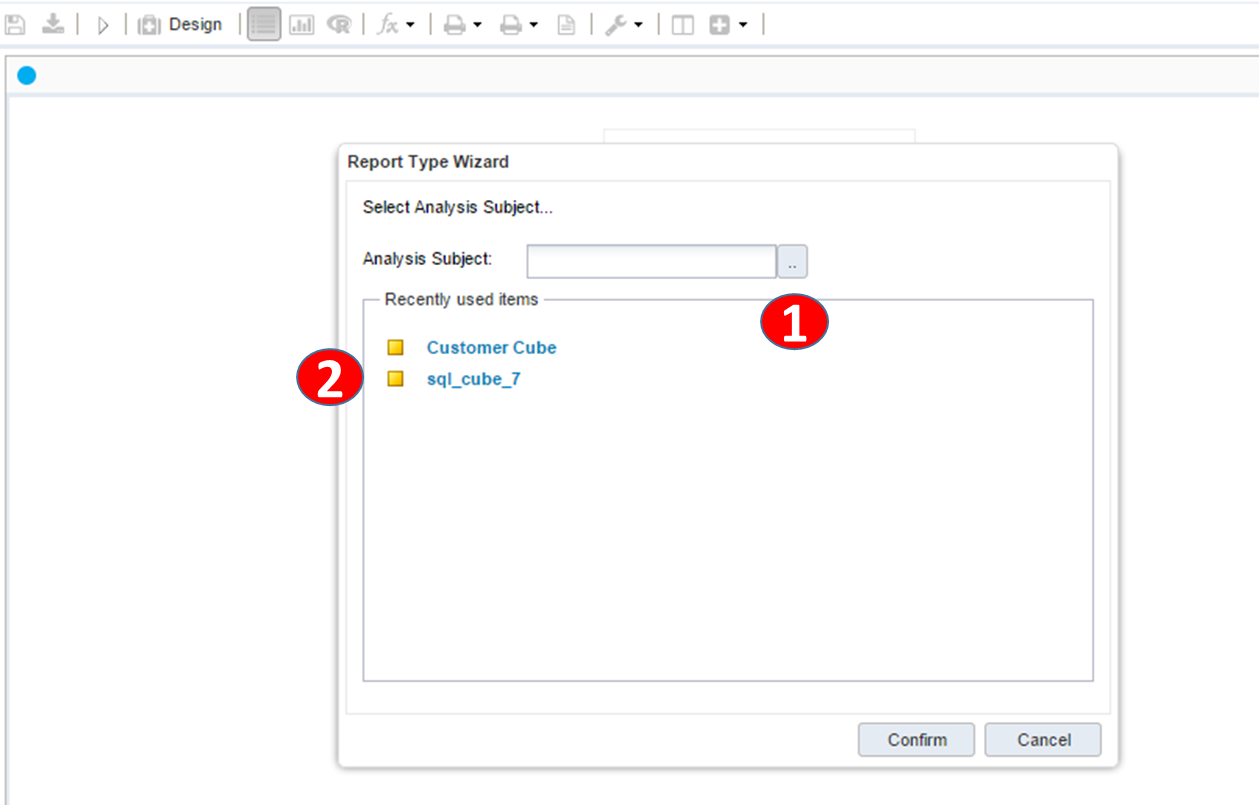
Click the report item created in the navigation list to open the edit screen.
|
Select the analysis business object entity. |
|
|
|
|
|
1 |
Select the business object entity to use for the analysis. Select the Customer you created. |
|
2 |
A list of existing analysis business object is displayed. If it is not listed, click the 1 button to select it. Click the OK button after selecting. |
Config Pivot Information
|
Set pivot information in pivot design mode. |
|
|
|
|
|
1 |
Click the design button on the report toolbar to switch to design mode. |
|
2 |
Drag items from the business analysis folder and drop them into the row / column / measure area respectively. |
|
3 |
Target row area to be retrieved, column area, measure area |
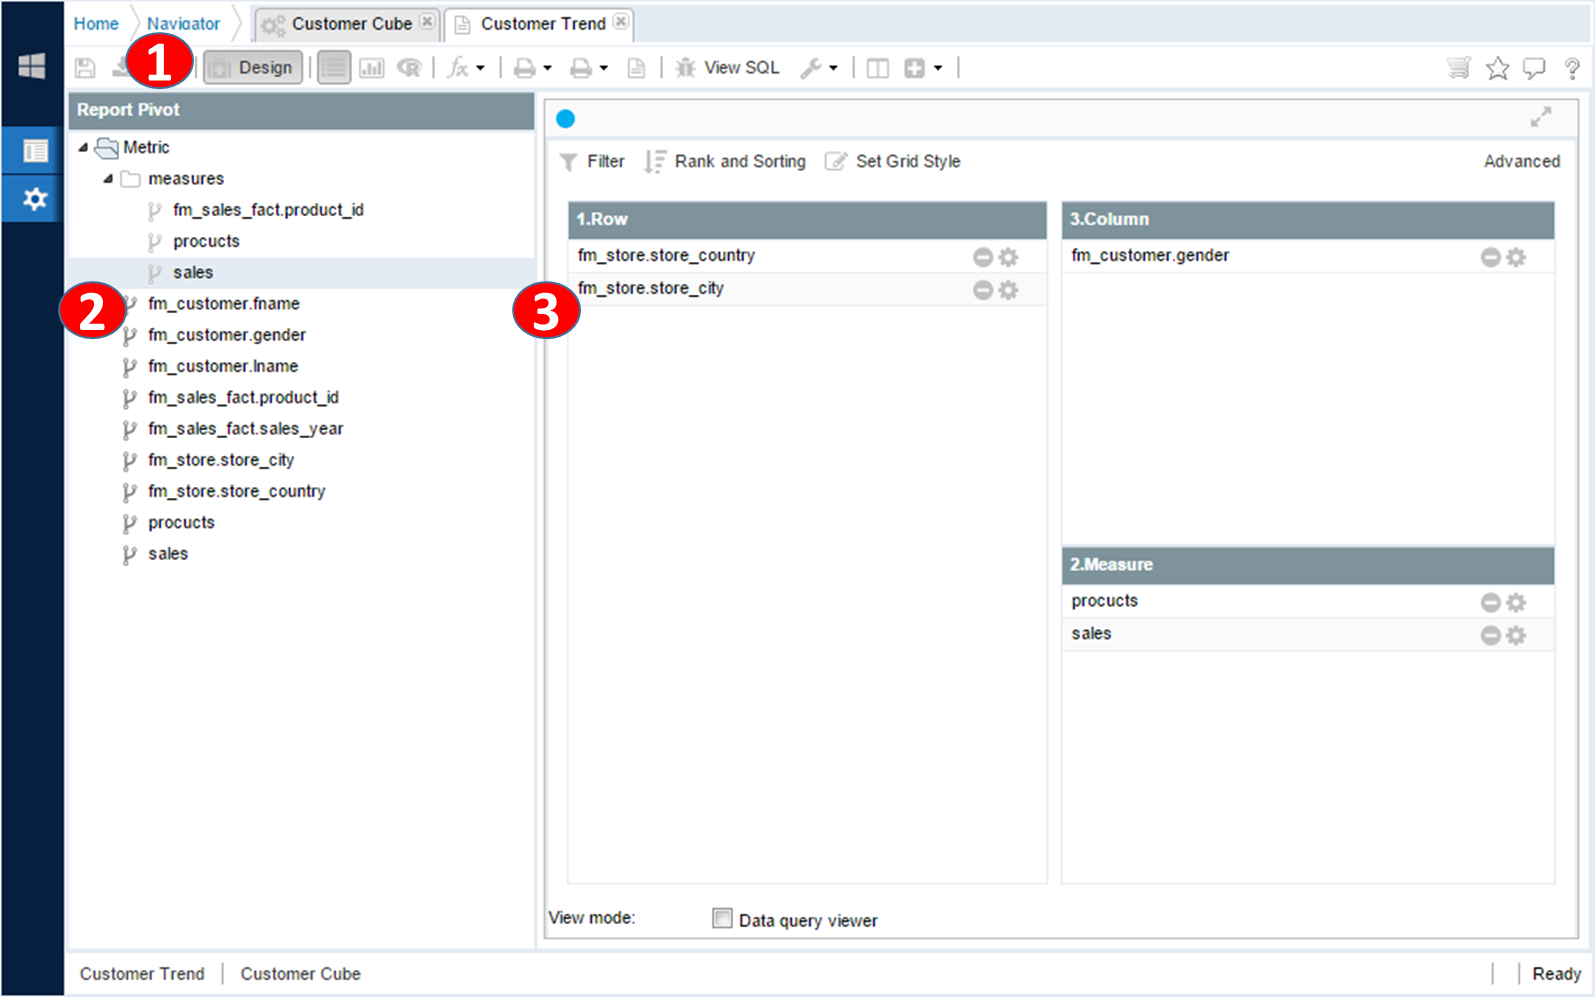
Click the Run button to view the report.
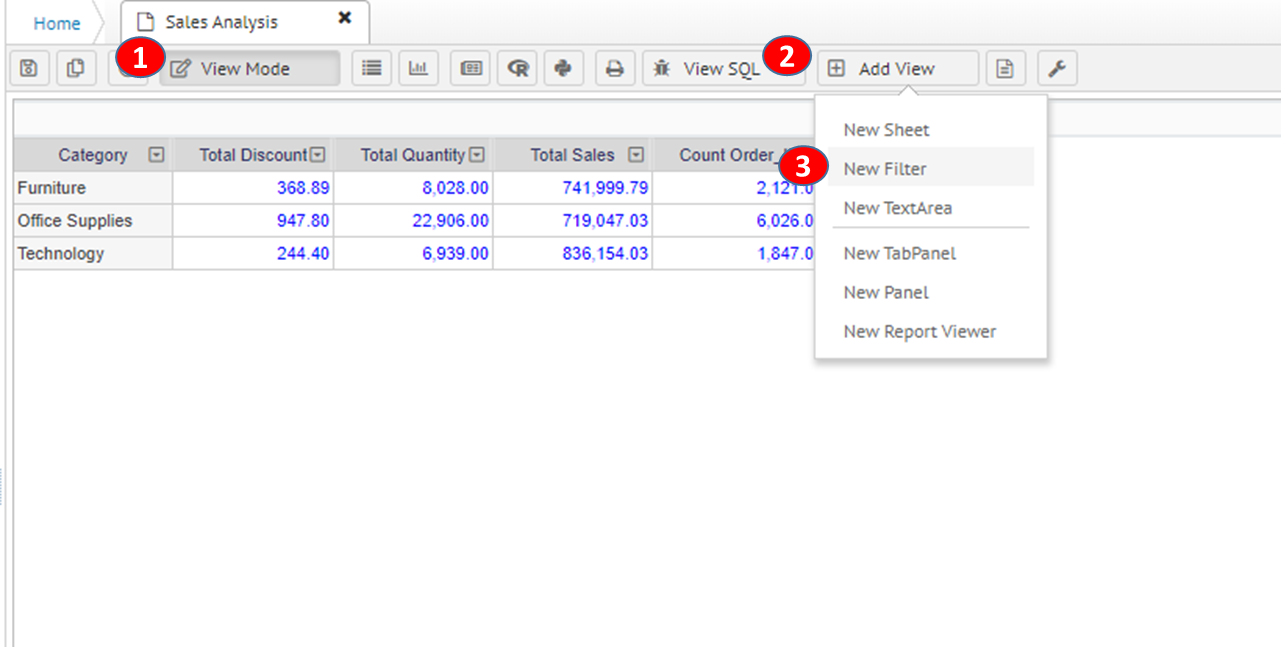
Adding Filter Panel
|
Add a filter panel item. |
|
|
|
|
|
1 |
Click the design button on the report toolbar to switch to design mode. |
|
2 |
Drag items from the business analysis folder and drop them into the row / column / measure area respectively. |
|
3 |
Target row area to be retrieved, column area, measure area |
|
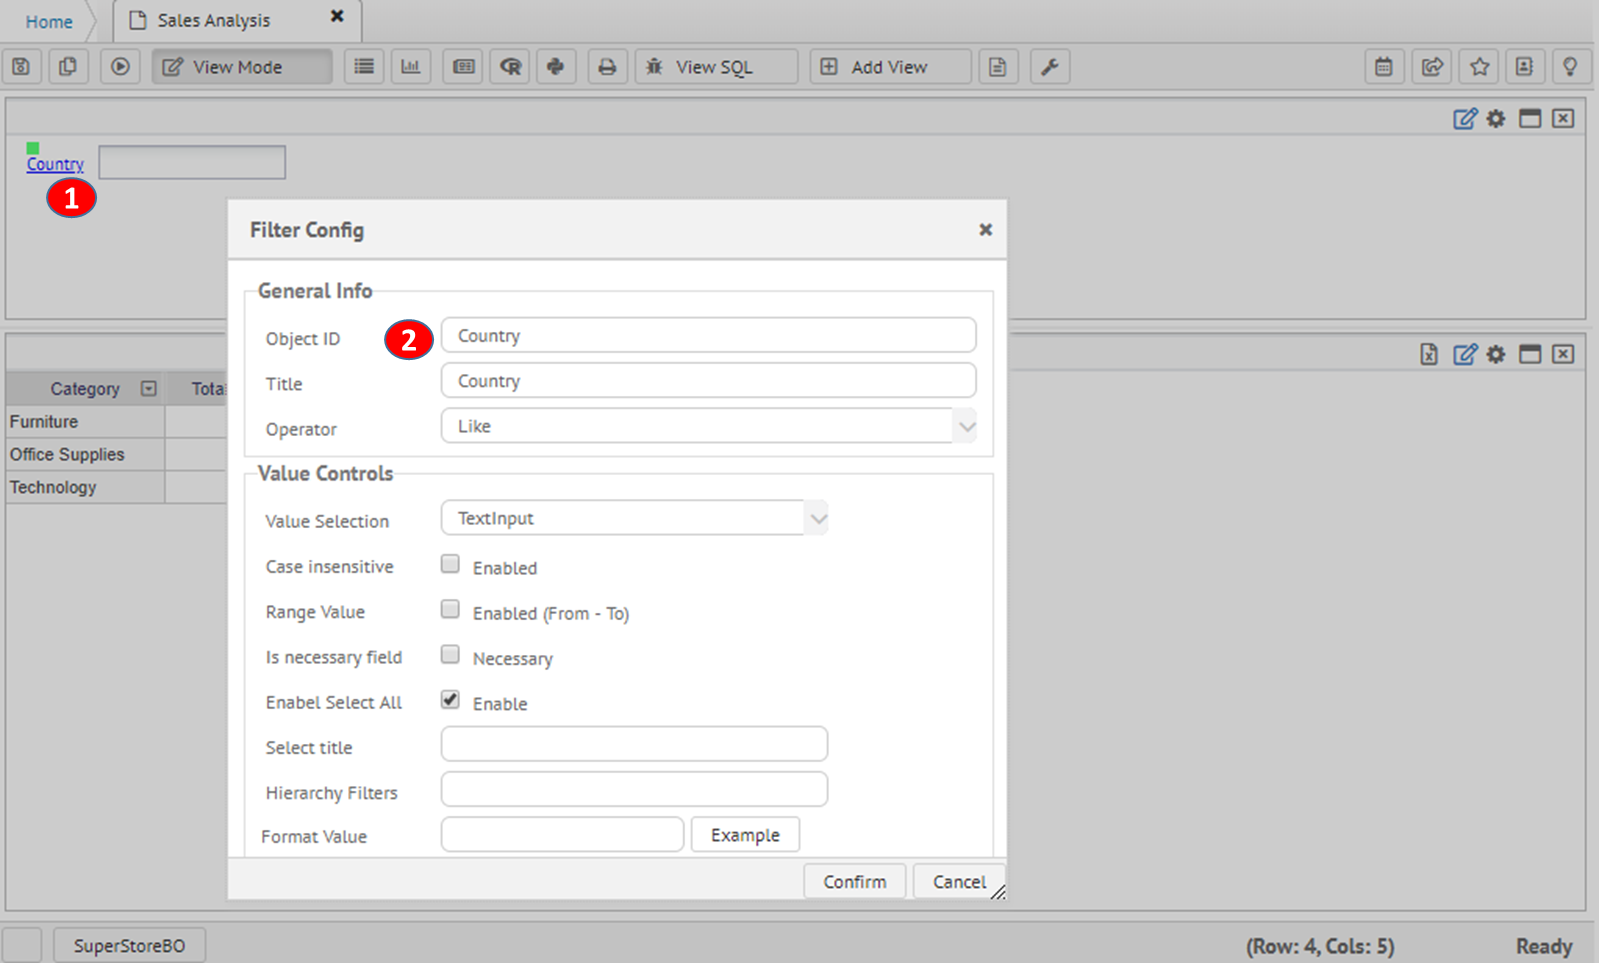
Modify the layout properties. |
|
|
|
|
|
1 |
Click the design button on the report toolbar to switch to design mode. |
|
2 |
Drag items from the business analysis folder and drop them into the row / column / measure area respectively. |
|
3 |
Target row area to be retrieved, column area, measure area |
|
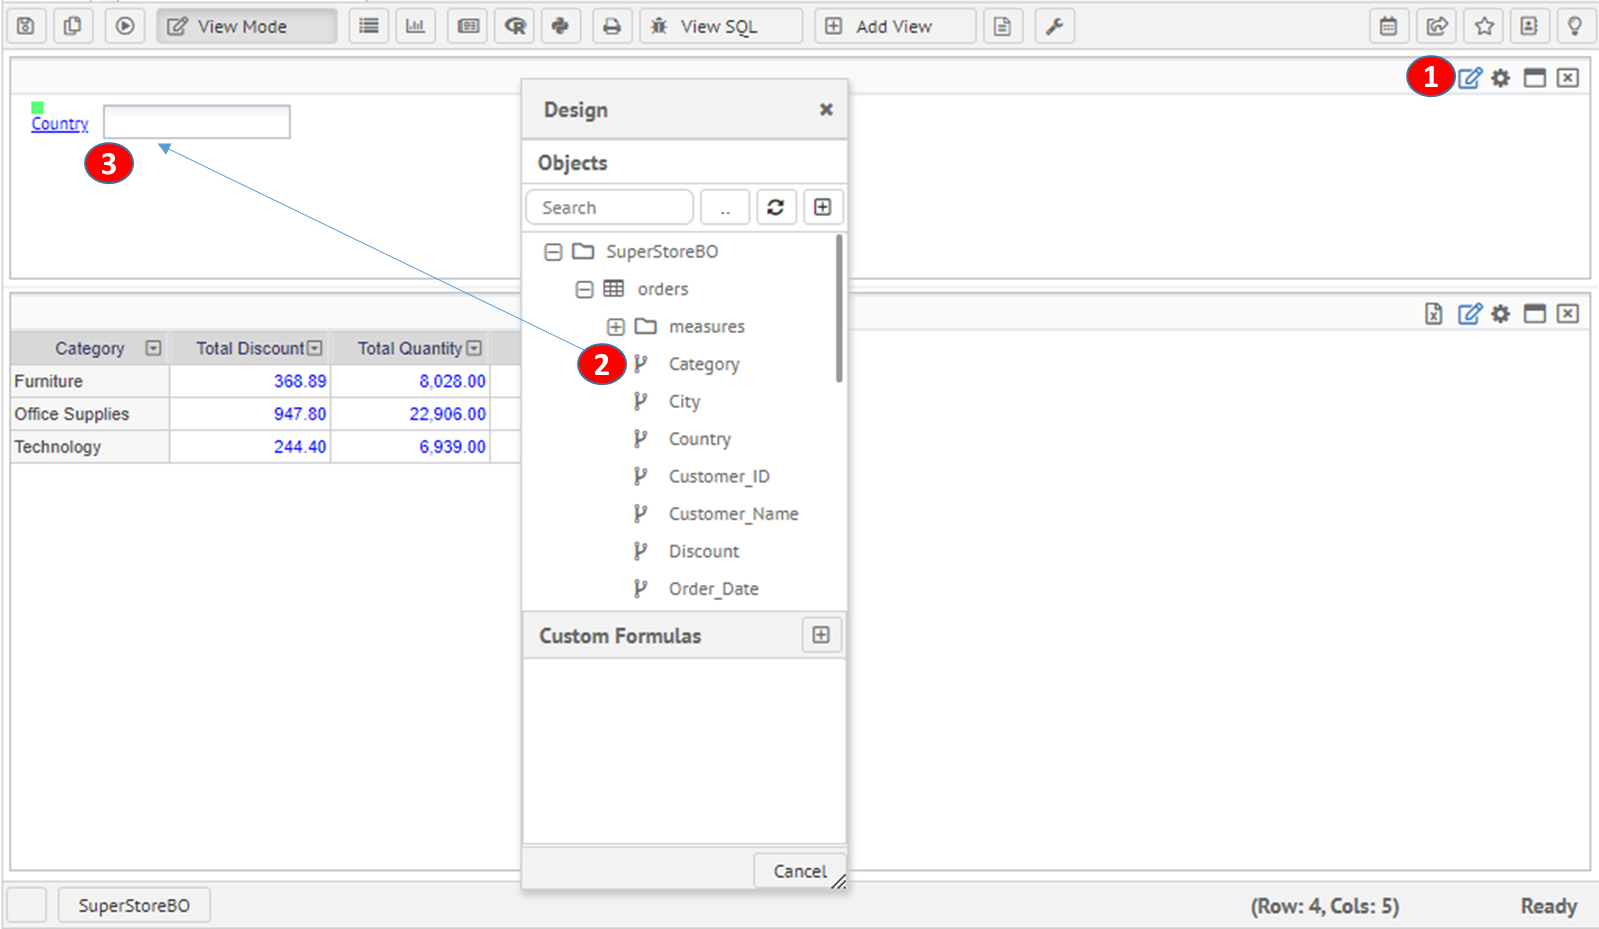
Drag the filter item and register it as a filter item. |
|
|
|
|
|
1 |
Click the design button on the report toolbar to switch to design mode. |
|
2 |
Drag items from the business analysis folder and drop them into the row / column / measure area respectively. |
|
3 |
Target row area to be retrieved, column area, measure area |
Switch to Run mode to view the report.
Dashboard using Drill Filtering
|
Add a drill target sheet item |
|
|
|
|
|
1 |
Click the design button on the report toolbar to switch to design mode. |
|
2 |
Drag items from the business analysis folder and drop them into the row / column / measure area respectively. |
|
3 |
Target row area to be retrieved, column area, measure area |
|
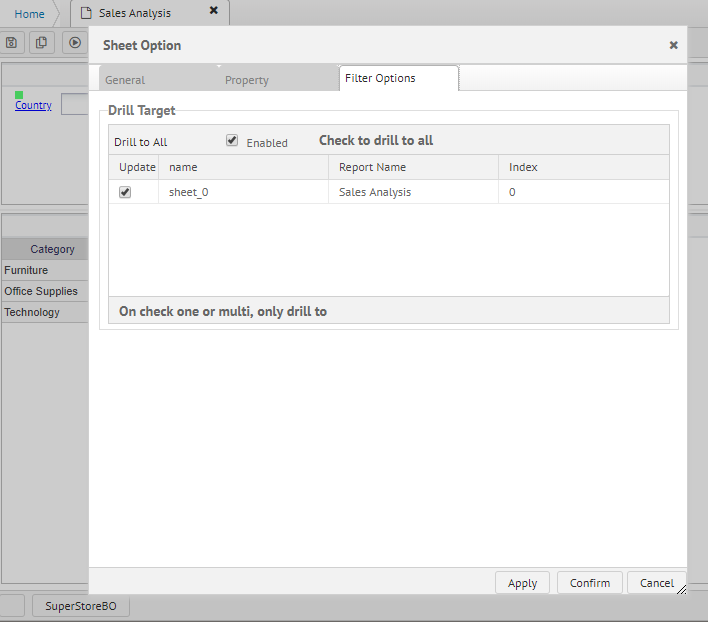
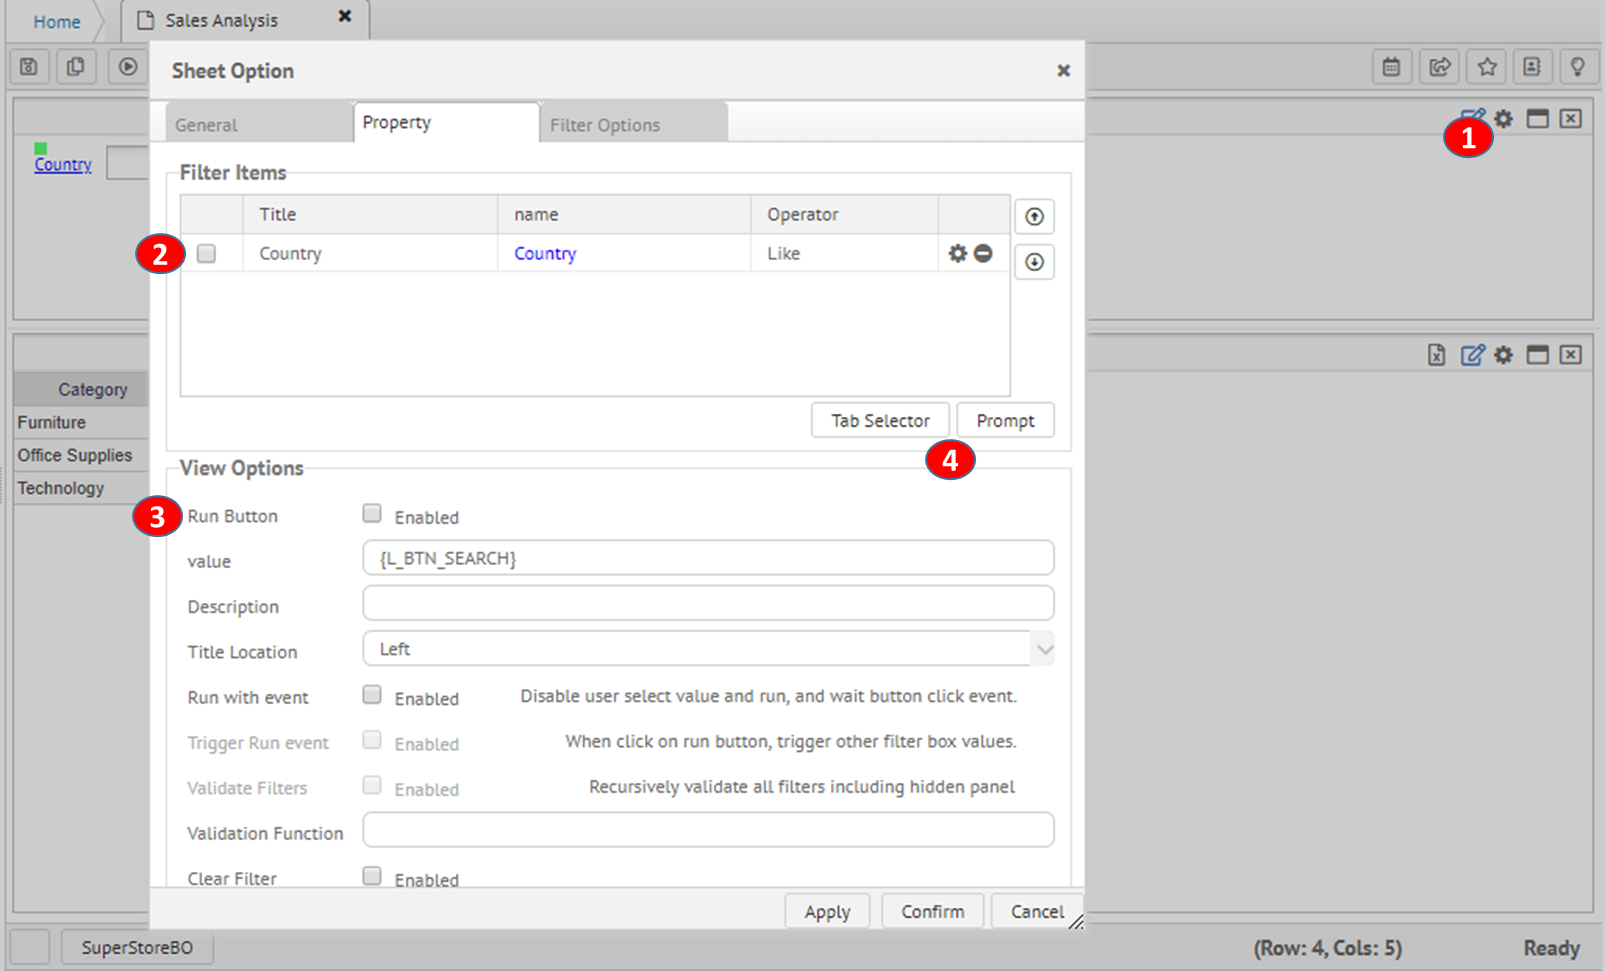
Configuring Filtering target sheets and options |
|
|
|
|
|
1 |
Modify the layout properties. |
|
2 |
Drag items from the business analysis folder and drop them into the row / column / measure area respectively. |
|
3 |
Target row area to be retrieved, column area, measure area |
|
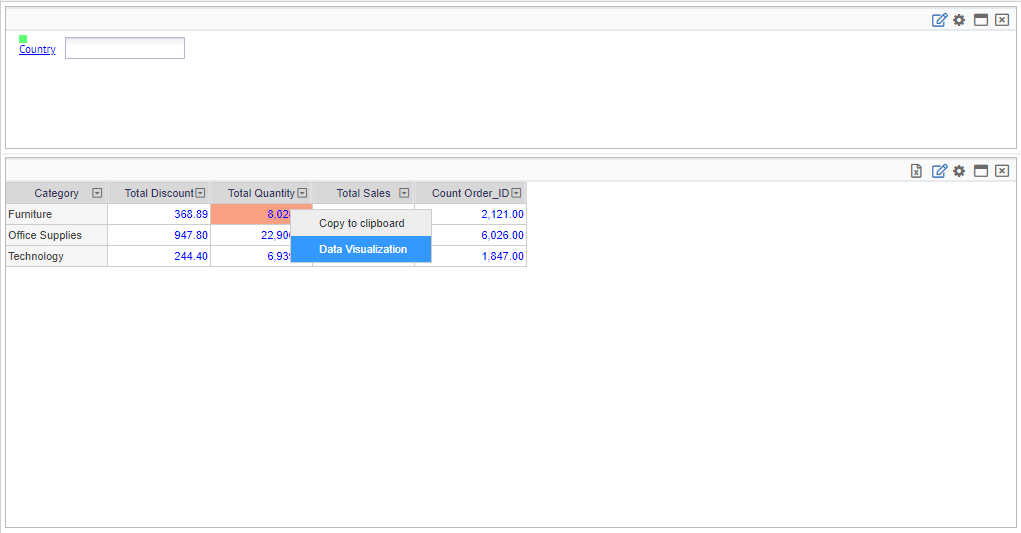
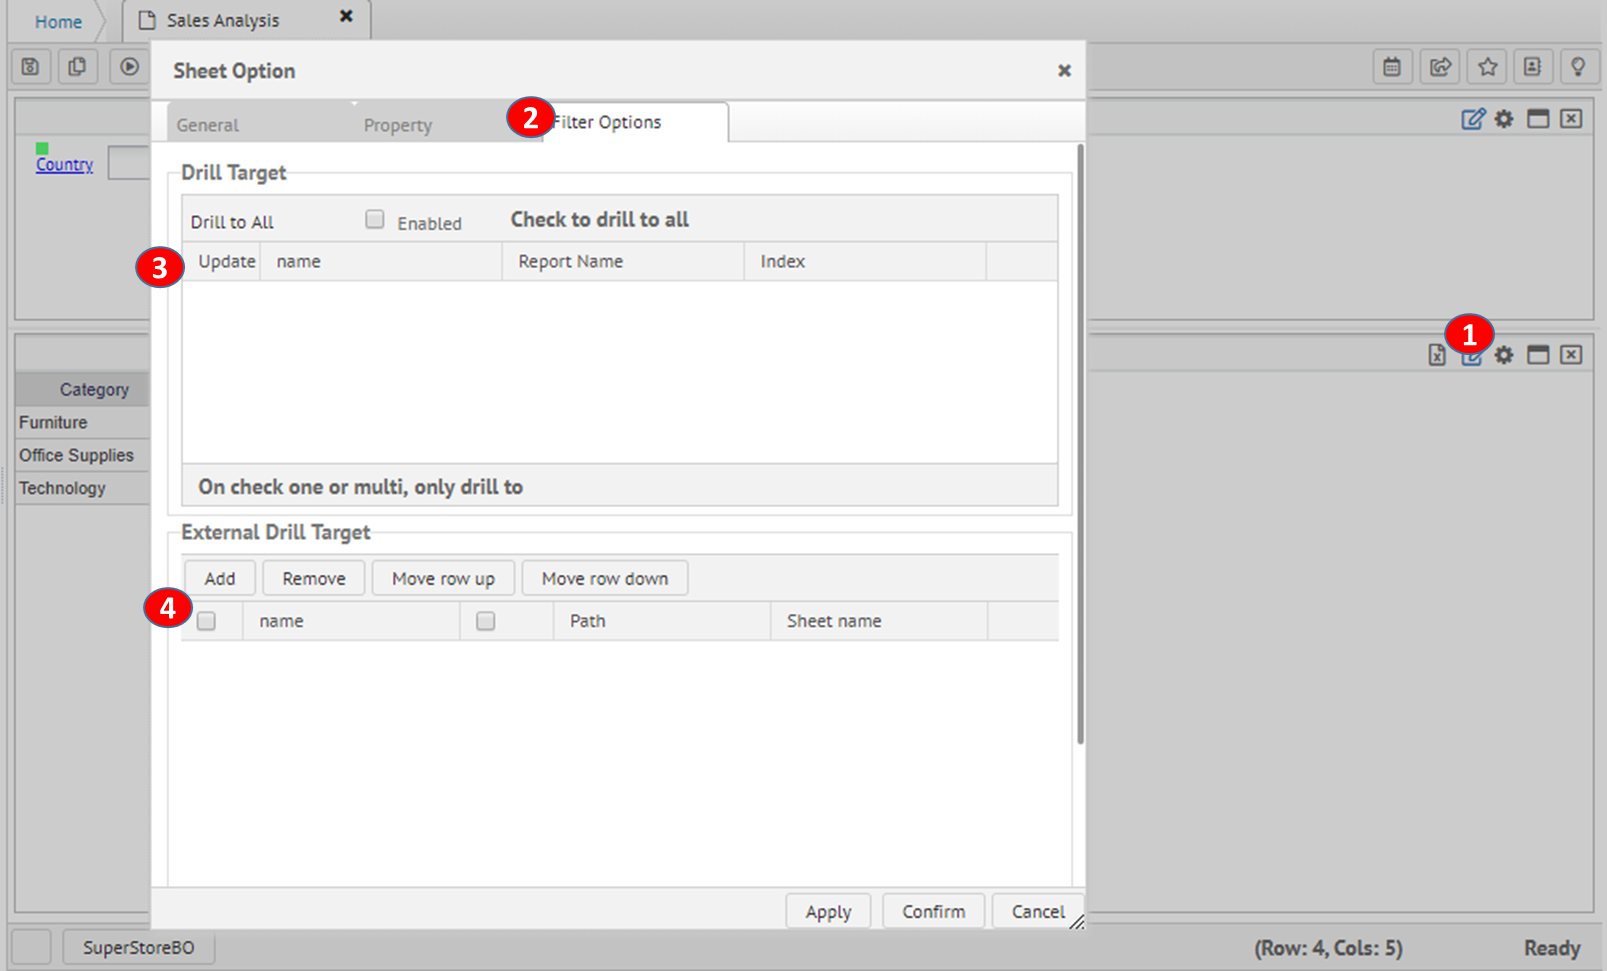
Adding Drill to Detail Reports for selected region |
|
|
|
|
|
1 |
Click the design button on the report toolbar to switch to design mode. |
|
2 |
Drag items from the business analysis folder and drop them into the row / column / measure area respectively. |
|
3 |
Target row area to be retrieved, column area, measure area |