Six Sigma Quality Control
- Easy solutions for
continuous improvements
Introduction
Six Sigma is base methodology to improve business processes and production quality. The goal of Six Sigma is to control defects under 3.4 items per million. In this article, will introduce easy statistical method and tools to help operators more efficient and effective data generations with data on semiconductor manufacturing processes.
We provides a easy designation to access data driven, just in time statistical approach to quality improvements without IT burden nor technical, mathematical backgrounds. Helping end user to understand data, visualize with various charts and organized outputs just like professional data scientists do for their work.
Maximize the quality with reasonable costs on optimal manufacturing processes. Here is the best solution to achieve this and successful adapting in business market and next generation manufacturing evolution.
A set of tools and techniques that mostly used for our manufacturing clients are as follows:
- Histogram
- Pareto Chart
- Control Chart
- Clustering Data
Semiconductor Manufacturing Quality Control
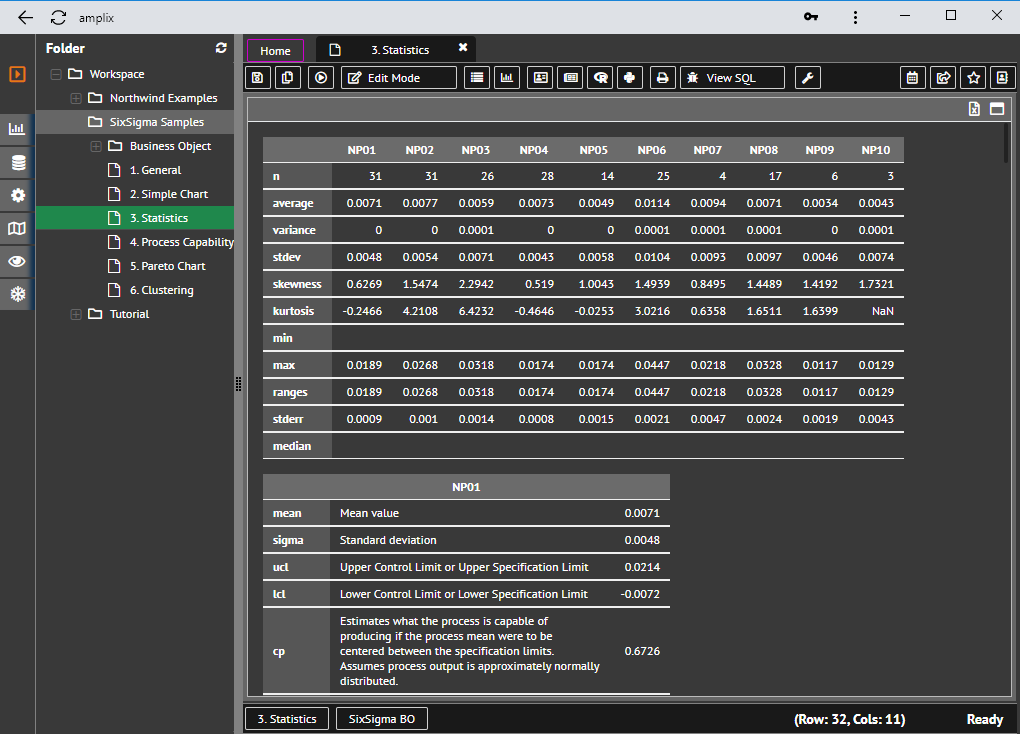
Descriptive Statistics of data
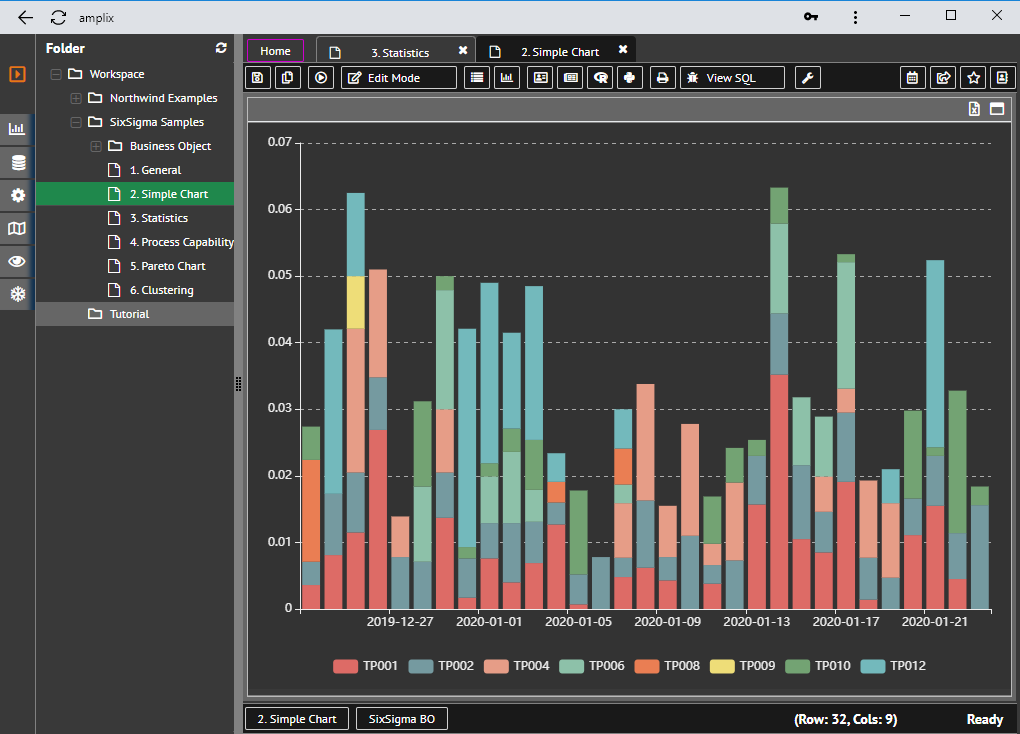
Simple Stacked Chart
Histogram
Histogram is numerical values into grouped values and make charts with this grouped names. For example, for unit prices of product, you might need to group with different label such as Low, Medium, High, Extra High. Or you can divide values with ranges such as less then 10, 11~20, 21~30, 31~40, more then 40.
And then you can get how much products or how much sales are distributed in each ranged group.
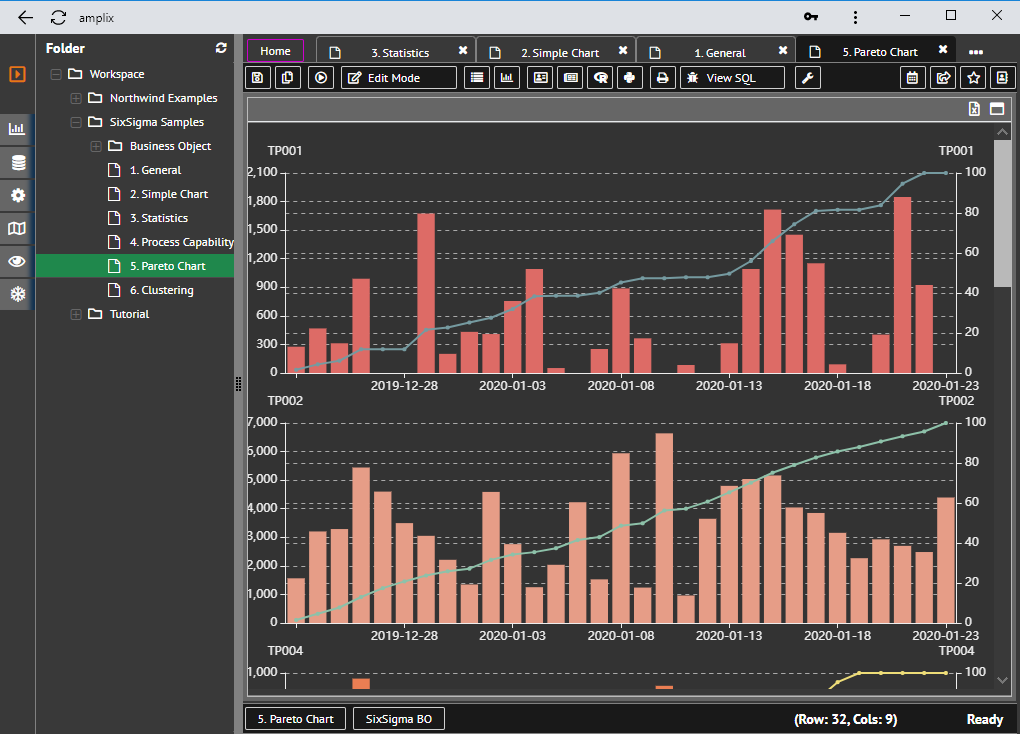
Pareto Chart
A Pareto chart is a type of chart that contains both bars and a line graph, where individual values are represented in descending order by bars, and the cumulative total is represented by the line. — Wikipedia
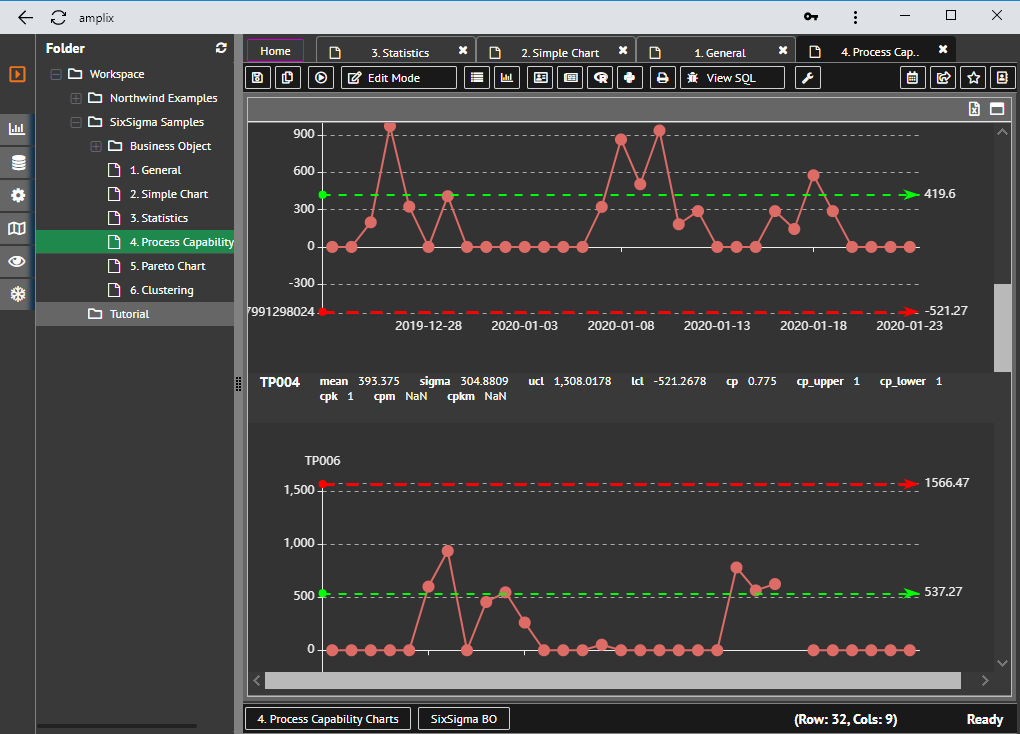
Control Chart
Control charts, also known as Shewhart charts (after Walter A. Shewhart) or process-behavior charts, are a statistical process control tool used to determine if a manufacturing or business process is in a state of control. It is more appropriate to say that the control charts are the graphical device for Statistical Process Monitoring (SPM). — Wikipedia
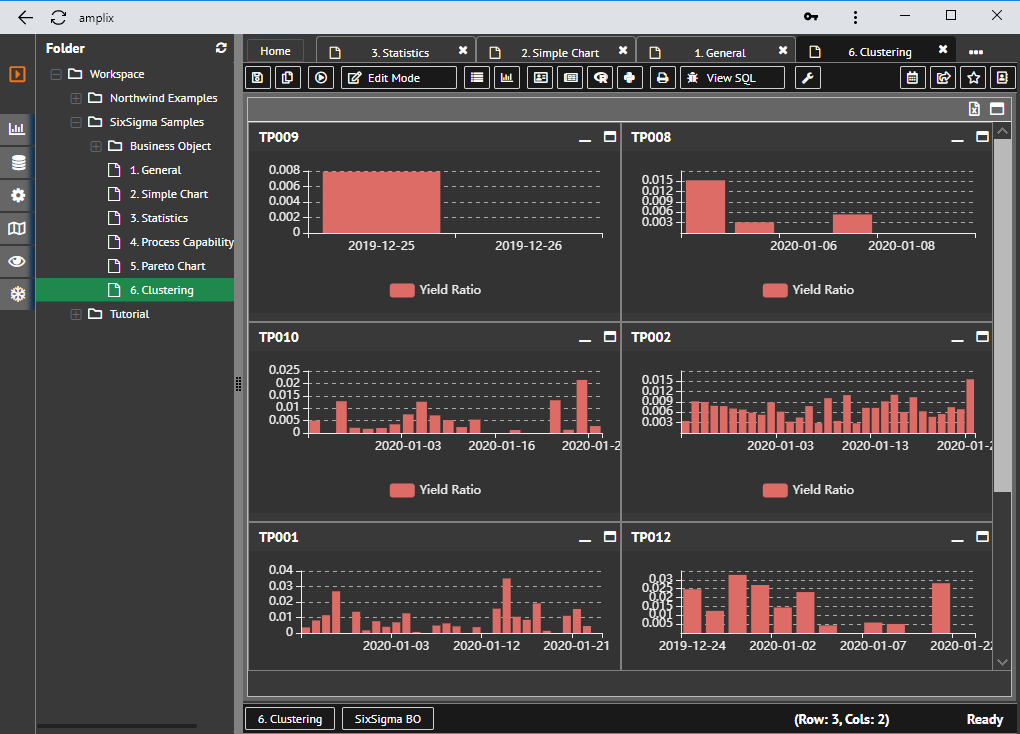
Clustering Charts
For more information
Besides NLP based business automation, there are great features you might interest on:
- End user pivot reporting, data visualization without programming effort.
- Interactive Dashboard building for data drilling with integrated Apache ECharts.
- Database ER diagrams for AdHoc query building.
- Python Jupyter notebook into reports and R statistical engine.
- Statistical formula supports compatible with IBM SAS.
- NLP based robotic business automation.
- Support web standards and provides simple but powerful UX for developers and business end users as well.
- Cloud data integration for Salesforce.
- Oracle Discoverer migration with business area and workbooks into seamless mapping with new features.
- Financial reporting with cloud based services including Oracle Netsuite, SAP, Oracle ERP.
- Machine learning and decision tree with Markov decision processing.
For more information, please visit amplixbi.com And request demo.
Open a door for your advanced business environment. We hope to hear from you soon.
Enjoy!